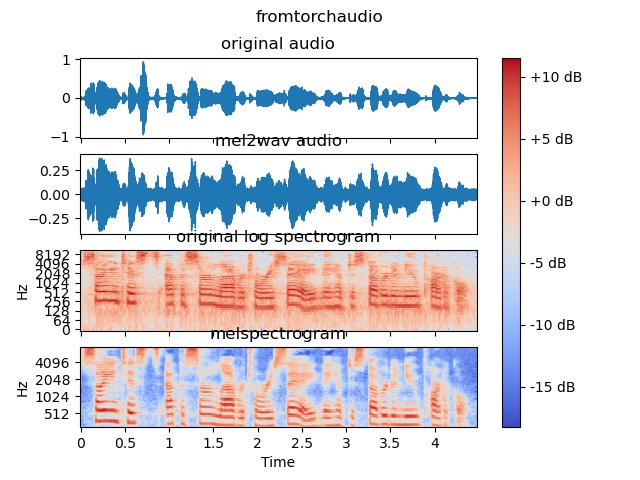
first: use torchaudio.transforms.MelSpectrogram to get melspectrum
second: use torchaudio.transforms.InverseMelScale to get spectrum
third: use torchaudio.transforms.GriffinLim reconstruct wav
but the wav has obviously electric current sound
here is the pic
here is the wav file
https://github.com/BestUO/blogphotos/blob/main/torchaudio.wav?raw=true
and my code
import torch
import torchaudio
y, sr = librosa.load("./audio/demo.wav",sr=22050)
n_fft = 1024

# linear_spectrogram = spectrogramtransform(torch.from_numpy(y))
transform = torchaudio.transforms.Spectrogram(n_fft=n_fft, win_length=n_fft, hop_length=n_fft//4)
linear_spectrogram = transform(torch.from_numpy(y))

transform = torchaudio.transforms.MelSpectrogram(sample_rate=sr, n_mels=80,
n_fft=n_fft, win_length=n_fft, hop_length=n_fft//4, f_max=7600, f_min=125)
mel_spectrogram = transform(torch.from_numpy(y))  # (channel, n_mels, time)

transform = torchaudio.transforms.InverseMelScale(sample_rate=sr, n_stft=n_fft//2+1, n_mels=80, f_max=7600, f_min=125)
spectrogram = transform(mel_spectrogram)

# transform = torchaudio.transforms.InverseSpectrogram(n_fft=n_fft, win_length=n_fft, hop_length=n_fft//4)
# isp = torch.tensor(isp,dtype=torch.cdouble)
# y = transform(isp)

transform = torchaudio.transforms.GriffinLim(n_fft=n_fft, win_length=n_fft, hop_length=n_fft//4)
mel_audio = transform(spectrogram)
sf.write('audio/torchaudio.wav', mel_audio, sr, subtype='PCM_24')

# mel_audio2 = librosa.feature.inverse.mel_to_audio(mel_spectrogram.numpy(),sr=sr,n_fft=n_fft, win_length=n_fft, hop_length=n_fft//4,fmax=7600,fmin=125)
# mel_audio2 = librosa.feature.inverse.griffinlim(spectrogram.numpy(),n_fft=n_fft, win_length=n_fft, hop_length=n_fft//4)
# sf.write('audio/torchaudio2.wav', mel_audio2, sr, subtype='PCM_24')

fig, ax = plt.subplots(nrows = 4,sharex = True)
librosa.display.waveshow(y,sr=sr, x_axis='time', ax=ax[0])
ax[0].set(title="original audio")
ax[0].label_outer()

librosa.display.waveshow(mel_audio.numpy(),sr=sr, x_axis='time', ax=ax[1])
ax[1].set(title="mel2wav audio")
ax[1].label_outer()

img = librosa.display.specshow(linear_spectrogram.log2().numpy(), y_axis='log', x_axis='time', sr=sr,  ax=ax[2],
n_fft=n_fft, win_length=n_fft, hop_length=n_fft//4, fmax=7600, fmin=125)
ax[2].set(title="original log spectrogram")
ax[2].label_outer()

img = librosa.display.specshow(mel_spectrogram.log2().numpy(), y_axis='mel', x_axis='time', sr=sr, ax=ax[3],
n_fft=n_fft, win_length=n_fft, hop_length=n_fft//4, fmax=7600, fmin=125)
ax[3].set(title="melspectrogram")

fig.suptitle("fromtorchaudio")
fig.colorbar(img, ax=ax, format="%+2.f dB")
plt.savefig("audio/fromtorchaudio.jpg")
plt.show()
please tell me how this happened and how to fix it