I am using this notebook which is combination of 3 notesbooks (linked in the second cell) for finetuning the Inception V3 for training the last layers on a cats and dogs dataset (from Kaggle).
import torchvision.models as models

model_ft = models.inception_v3(pretrained=True)
for param in model_ft.parameters():
    param.requires_grad = False

# Parameters of newly constructed modules have requires_grad=True by default
# Handle the auxilary net
num_ftrs = model_ft.AuxLogits.fc.in_features
model_ft.AuxLogits.fc = nn.Linear(num_ftrs, 2)
# Handle the primary net
num_ftrs = model_ft.fc.in_features
model_ft.fc = nn.Linear(num_ftrs, 2)
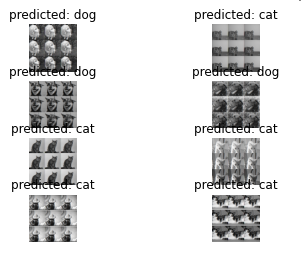
I am trying to understand if I have done this correctly, so I decided to use the visualization module from PyTorch trainings. However, I get some problem in visualization in cell [57].
Error is:
ValueError                                Traceback (most recent call last)
Input In [57], in <module>
----> 1 visualize_model(model_ft)

Input In [56], in visualize_model(model, num_images)
     15 for j in range(inputs.size()[0]):
     16     images_so_far += 1
---> 17     ax = plt.subplot(num_images//2, 2, images_so_far)
     18     ax.axis('off')
     19     ax.set_title('predicted: {}'.format(class_names[preds[j]]))

File ~/research/venv/dpcc/lib/python3.8/site-packages/matplotlib/pyplot.py:1268, in subplot(*args, **kwargs)
   1265 fig = gcf()
   1267 # First, search for an existing subplot with a matching spec.
-> 1268 key = SubplotSpec._from_subplot_args(fig, args)
   1270 for ax in fig.axes:
   1271     # if we found an axes at the position sort out if we can re-use it
   1272     if hasattr(ax, 'get_subplotspec') and ax.get_subplotspec() == key:
   1273         # if the user passed no kwargs, re-use

File ~/research/venv/dpcc/lib/python3.8/site-packages/matplotlib/gridspec.py:608, in SubplotSpec._from_subplot_args(figure, args)
    606 else:
    607     if not isinstance(num, Integral) or num < 1 or num > rows*cols:
--> 608         raise ValueError(
    609             f"num must be 1 <= num <= {rows*cols}, not {num!r}")
    610     i = j = num
    611 return gs[i-1:j]

ValueError: num must be 1 <= num <= 8, not 9
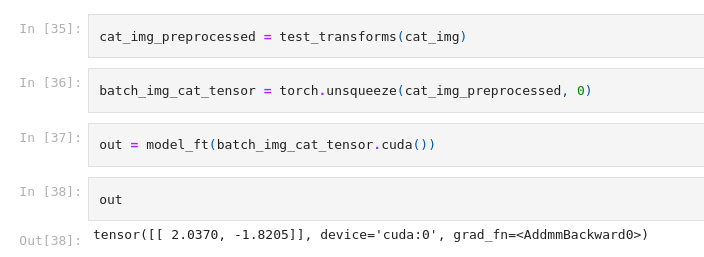
Also, based on the output I get in cell 38, is it fair to say that since the first element in output tensor is larger and I only have two classes, so it is a cat? I actually am testing on a random cat image from Web for this cell.