Hi,
I have used the profiler on the top file like this:
    # Start sut before loadgen starts
    with profile(activities=[ProfilerActivity.CPU, ProfilerActivity.CUDA],
                 record_shapes=True,
                 profile_memory=True,
                 with_stack=True) as prof:
         with record_function("llama_inference_run"):
            sut.start()
            lgSUT = lg.ConstructSUT(sut.issue_queries, sut.flush_queries)
            log.info("Starting Benchmark run")
            lg.StartTestWithLogSettings(
                lgSUT,
                sut.qsl,
                settings,
                log_settings,
                args.audit_conf)
    prof.export_chrome_trace("llama3_trace3.json")
    # Stop sut after completion
    sut.stop()
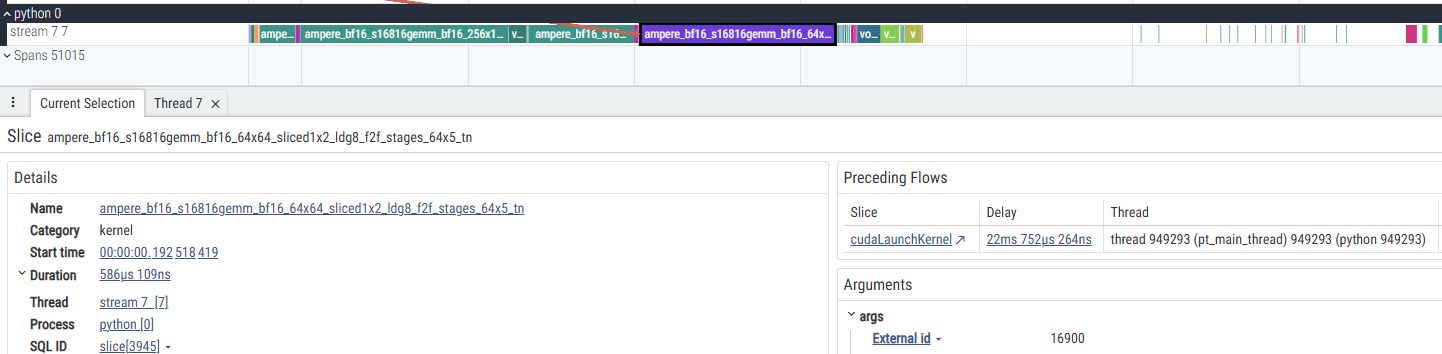
Notice that I have specified profile_memory and with_stack for more in-depth analysis. I have opened the output file using perfetto.dev website, and the figure shows a CUDA kernel information.
Additionally, the Pythono process has three threads:

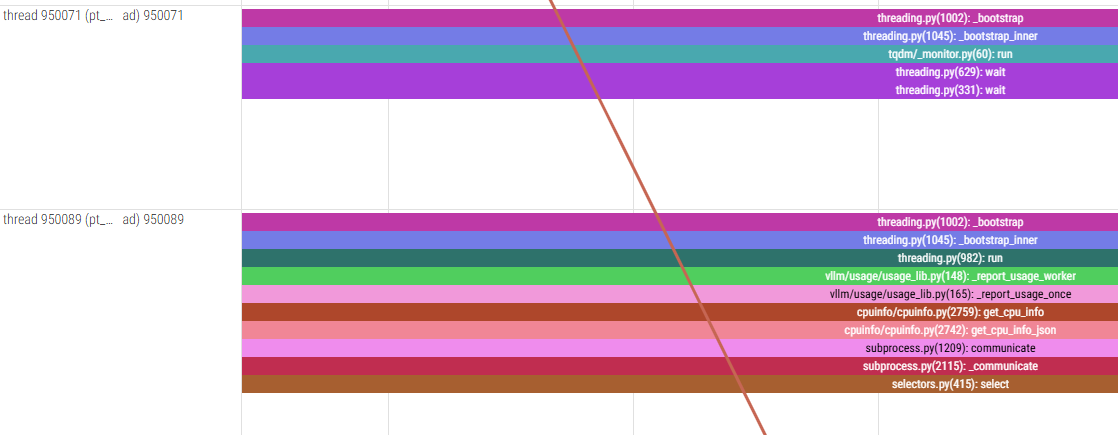
The call stack looks a bit weird to me. Still I don’t understand how that CUDA kernel is called. The file names, such as subprocess and threading are too high level. Or maybe I am misunderstanding the call stack.
Additionally, I don’t know where is the result of profile_memory in the figure and output file.
Any thoughts on that?