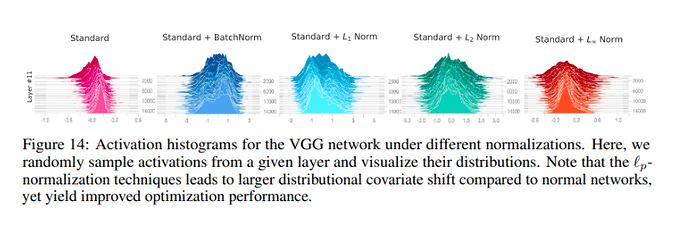
I wanted to visualise my layer outputs. Say the output is [32X512X7X7] where 32 is batch size and 512 is the number of channels. How am I supposed to visualise a plot of this sort.
You could use the add_histogram method to create this visualization.
If I’m not mistaken, the way to do so would be to get the forward activations (e.g. using forward hooks), flatten them, and use the aforementioned method.
Are you sure that we have to flatten them? I mean, you will get a 32X512X7X7 vector. How shall I add that to this function?
Not 100% sure, but I would assume you would like to visualize the histogram from all values in the batch, right?
