Is there a simple way to plot the loss and accuracy live during training in pytorch?
2 Likes
You could use Visdom for this. Have a look at this example to plot your stats live.
Let me know if you encounter any issues.
6 Likes
New to pytorch.
Too much of code, looks complicated.
Unable to get what the actual code is doing.
1 Like
Used this
import visdom

vis = visdom.Visdom()

#after calculating error per epoch
vis.line(Y=epoch_loss, opts=dict(showlegend=True))
I’m getting this error
Epoch 0/32
train Loss: 2.4588 Acc: 0.5385
Traceback (most recent call last):
File “simpletest.py”, line 207, in
model_ft = train_model(net,criterion,optimizer_ft,exp_lr_scheduler,num_epochs=33)
File “simpletest.py”, line 175, in train_model
vis.line(Y=epoch_loss, opts=dict(showlegend=True))
File “/home/ffffff/.virtualenvs/LearnPytorch/lib/python3.6/site-packages/visdom/init.py”, line 288, in wrapped_f
return f(*args, **kwargs)
File “/home/ffffff/.virtualenvs/LearnPytorch/lib/python3.6/site-packages/visdom/init.py”, line 1171, in line
assert Y.ndim == 1 or Y.ndim == 2, ‘Y should have 1 or 2 dim’
AttributeError: ‘float’ object has no attribute ‘ndim’
Shouldn’t the plot be error per epoch?
what would i use then matplotlib?
Try to pass the values as numpy arrays, e.g.
viz = visdom.Visdom()
epoch_loss = np.array([1.2])
viz.line(epoch_loss)
This did work, found it here https://www.programcreek.com/python/example/92356/visdom.Visdom
import visdom

vis = visdom.Visdom()

loss_window = vis.line(
    Y=torch.zeros((1)).cpu(),
    X=torch.zeros((1)).cpu(),
    opts=dict(xlabel='epoch',ylabel='Loss',title='training loss',legend=['Loss']))

vis.line(X=torch.ones((1,1)).cpu()*epoch,Y=torch.Tensor([epoch_loss]).unsqueeze(0).cpu(),win=loss_window,update='append')
How can I plot two lines in the same window?
You have to concatenate the values as column vectors:
Y = np.linspace(-5, 5, 100)
viz.line(
        Y=np.column_stack((Y * Y, np.sqrt(Y + 5))),
        X=np.column_stack((Y, Y)),
        opts=dict(markers=False),
)
1 Like
I am trying to plot the train loss and validation loss in the same window in Visdom but it’s giving me one line instead of two and also wrong values.
this is the snippet I am using.
criterion = nn.NLLLoss()
optimizer = optim.Adam(model.parameters(), lr=0.001)  # 1e-3
#optimizer = optim.SGD(model.parameters(), lr=0.00001, momentum=0.9)  # 1e-3

# Decay LR by a factor of 0.1 every 4 epochs.
#step size: Period of learning rate decay.
#gamma = Multiplicative factor of learning rate decay. Default: 0.1, should float
scheduler = lr_scheduler.StepLR(optimizer, step_size=2, gamma=0.1)


def train_model(model, criterion, optimizer, scheduler, num_epochs=4):

    vis = visdom.Visdom()
    loss_window = vis.line(X=numpy.zeros((1 ,)),
                           Y=numpy.zeros((1)),
                           opts=dict(xlabel='epoch',
                                     ylabel='Loss',
                                     title='epoch Loss and accuracy',
                                     ))
    since = time.time()

    best_model_wts = copy.deepcopy(model.state_dict())
    best_acc = 0.0

    for epoch in range(num_epochs):  # loop over the dataset multiple times
        print('Epoch {}/{}'.format(epoch, num_epochs - 1))
        print('-' * 30)

        # Each epoch has a training and validation phase
        for phase in ['train', 'valid']:
            if phase == 'train':
                scheduler.step()

                model.train()  # Set model to training mode
            else:
                model.eval()   # Set model to evaluate mode

            train_loss = 0.0
            total_train = 0
            correct_train = 0

            #iterate over data
            for t_image, mask, image_paths, target_paths in dataLoaders[phase]:

                # get the inputs
                t_image = t_image.to(device)
                mask = mask.to(device)

                 # zeroes the gradient buffers of all parameters
                optimizer.zero_grad()

                # forward
                # track history if only in train
                with torch.set_grad_enabled(phase == 'train'):
                    outputs = model(t_image)
                    _, predicted = torch.max(outputs.data, 1)
                    loss = criterion(outputs, mask) # calculate the loss

                    # backward + optimize only if in training phase
                    if phase == 'train':
                        loss.backward() # back propagation
                        optimizer.step() # update gradients

                # accuracy
                train_loss += loss.item()
                total_train += mask.nelement()  # number of pixel in the batch
                correct_train += predicted.eq(mask.data).sum().item() # sum all precited pixel values

            epoch_loss = train_loss / len(dataLoaders[phase].dataset)
            epoch_acc = (correct_train / total_train)

            print('{} Loss: {:.4f} Acc: {:.4f}'.format(
                phase, epoch_loss, epoch_acc))

            X1 = numpy.ones((1, 1))*epoch
            Y1 = numpy.array([epoch_loss ])
            Y2 = numpy.array([epoch_loss ])
            vis.line(
                    X=numpy.column_stack((X1, X1)),
                    Y=numpy.column_stack((Y1, Y2)),
                    win=loss_window,
                    update='append')

             #deep copy the model
            if phase == 'val' and epoch_acc > best_acc:
                best_acc = epoch_acc
                best_model_wts = copy.deepcopy(model.state_dict())

        print()
    time_elapsed = time.time() - since
    print('Training complete in {:.0f}m {:.0f}s'.format(
        time_elapsed // 60, time_elapsed % 60))
    print('Best val Acc: {:4f}'.format(best_acc))

    torch.save(model.state_dict(), 'train_valid_exp1.pth')
    # load best model weights
    model.load_state_dict(best_model_wts)
    return model

if __name__=='__main__':
    train_model()
1 Like
Currently you are plotting the same values twice (Y1 and Y2 have the same value).
I would rather store the train and val losses in an array and plot them together after both were calculated.
Let me know, if that helps.
1 Like
@ptrblck Could you please give me further explanation or example? Do you mean should I store epoch_loss one time for train and val separately as a numpy array and then plot them?
Yes, since you are currently overwriting it.
Since you are using phase to switch between train and valid, you could store the losses in a dict using the same keys:
losses = {}
for phase in ['train', 'valid']:
    ...
    losses[phase] = epoch_loss
2 Likes
You could try Minetorch , it’s a wrapper of PyTorch which support both Tensorboard and Matplotlib to visualize the loss and accuracy out of box. There’s a mnist sample you could try.
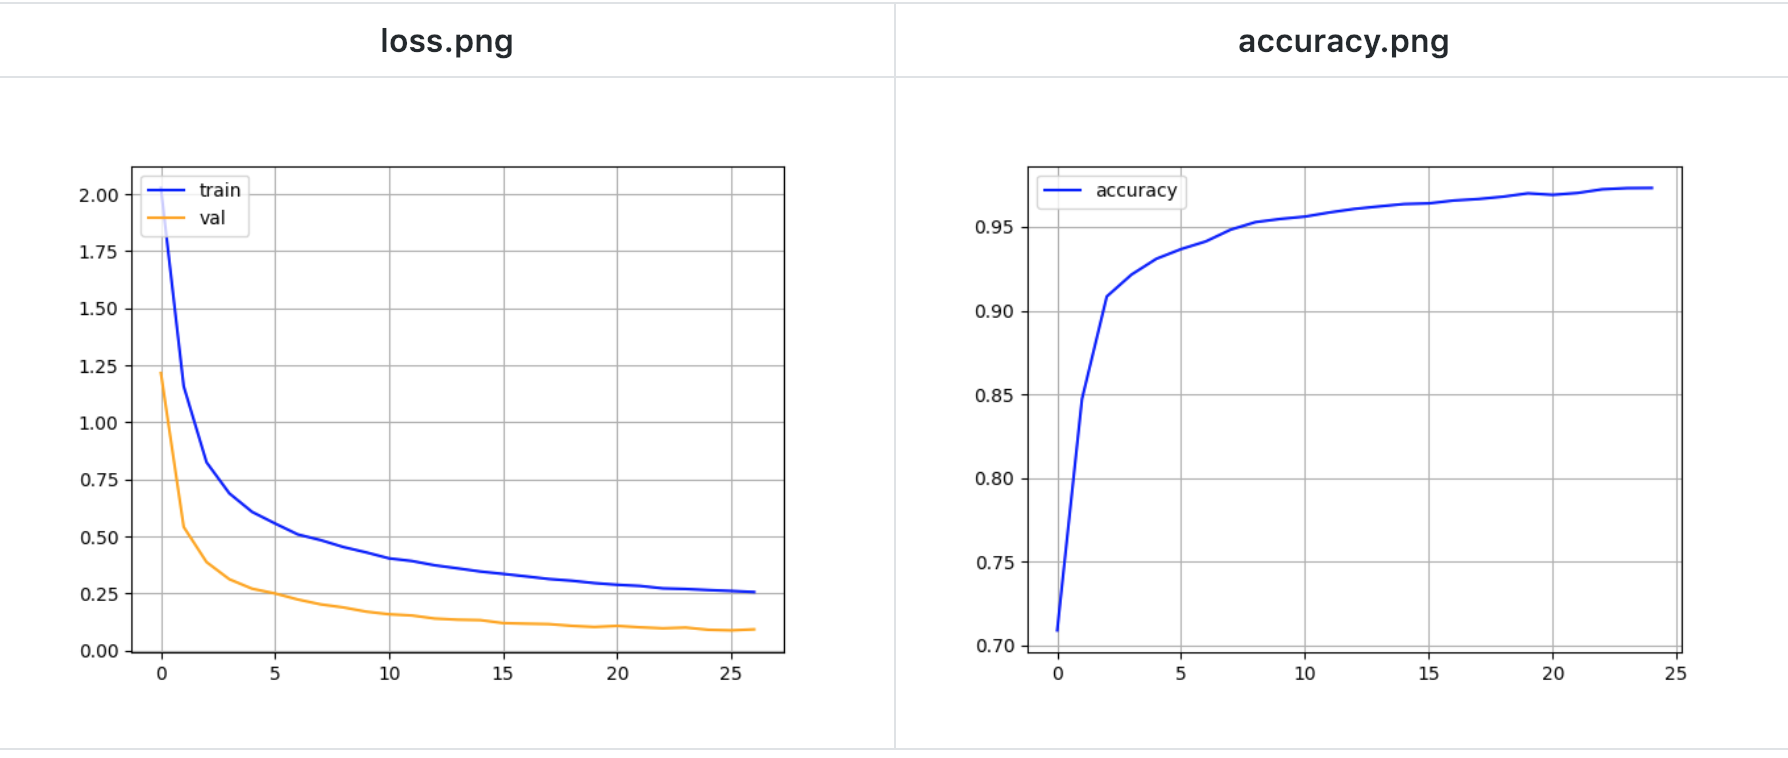
Some visualization
mnist example visualized with matplotlib
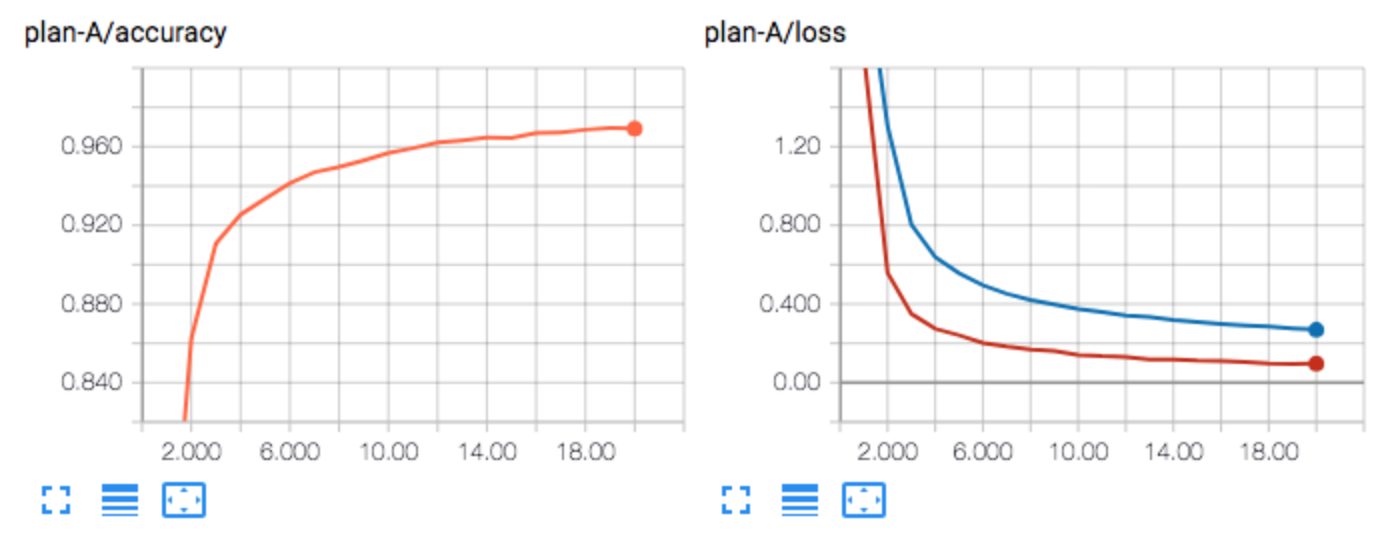
mnist example visualized with Tensorboard
2 Likes
Have a look at https://www.comet.ml and https://hyperdash.io. Both platforms provide real time monitoring of training parameters and are easy to use.
1 Like
You can also try Pierogi (Free and Open Source) :
https://github.com/stared/livelossplot worked like a charm for me! Very easy to use compared to some of the alternatives listed here!
@Santhoshnumberone if you are new to pytorch i would suggest, https://medium.com/datadriveninvestor/visualizing-training-and-validation-loss-in-real-time-using-pytorch-and-bokeh-5522401bc9dd
Very less functionalities… After starting from this, what I use is the tensorboard-pytorch module to get it to tensorboard-- https://pytorch.org/docs/stable/tensorboard.html
Hi Ptrblck
Sorry to take your time. I face a big problem. Indeed, I want to show the graph of True positive rate (y axis) to false positive rates (x axis) . I define my threshold in the case that sensitivity is consistent an the std is for x axis means false positive rates. I need to show the graph (ROC) of mean and std and the shade between them. the problem is that all the defined rules are as :
plt.fill_between(x, y1, y2,
                 facecolor="orange", # The fill color
                 color='blue',       # The outline color
                 alpha=0.2)
``` which give me the vise versa graph, indeed my y is consistent and the x has variation. If I change the x and y content the graph will be useless. Is there any option in the pytorch to fill the shade between graphs regardless of which of them has variation, indeed my variation or std is in horizontal way not vertical way.Hi Ptrblck
Do you know how I can save my figure in python to use and open them in Matlab. I need do some formatting in Matlab.
I think the easiest way would be to transform your tensors to numpy arrays via arr = tensor.numpy() and then to store these arrays using scipy.io.savemat to .mat files.
I’m not sure about your first question.
Could you post some dummy tensors for x, y1, and y2?