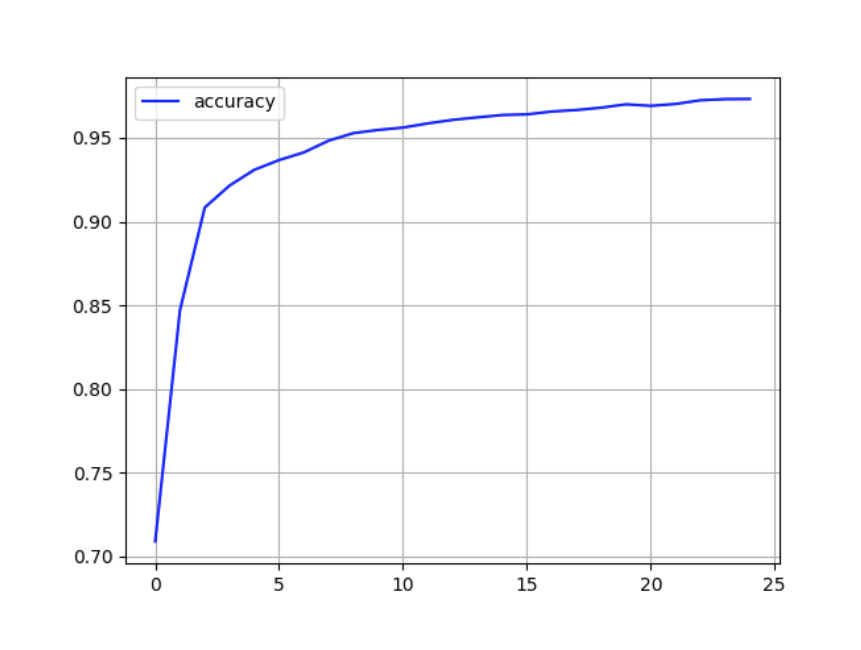
I want to generate accuracy/loss vs epoch graph from a trained model. Is it possible to do so? an example image is attached.
You could plot the accuracy e.g. using tensorboard as described here.
@ptrblck is it possible to generate graph with already trained pytorch model?
If you have saved the accuracy values for each epoch, this should be possible.
Otherwise, you would need to rerun the training and plot the metrics for each epoch.
Here is the code in python to do so:
from keras.callbacks import History
history = model.fit(X_test, y_train, epochs = 40, batch_size = 5, verbose = 1)
accuracy = history.history[“accuracy”]
epochs = range(1, len(accuracy) + 1)
import matplotlib.pyplot as plt
plt.plot(epochs, accuracy)
plt.show()
Hi @ptrblck ,
I hope you are doing well. Sorry, I am trying to fine tuning the GPT-2 on my system. I just become a bit obsessive about where I need to put optimizer.zero_grad() , it the code correct.? Many thnaks
device = torch.device('cuda' if torch.cuda.is_available() else 'cpu')
print(device)

print("***** Running training *****")
print("  Total_num_training_step = {}".format(total_num_training_steps))
print("  Num Epochs = {}".format(num_train_epochs))
print(f"  Train_batch_size per device = {train_batch_size}")
print(f"  Valid_batch_size per device = {valid_batch_size}")


model.to('cuda')

train_loss_1=[]
eval_loss_1=[]
perplexity_1=[]

for epoch in range(num_train_epochs):

    print(f"Start epoch{epoch+1} of {num_train_epochs}")
    train_loss=0

    epoch_iterator = tqdm(train_dataloader,desc='Iteration')

    model.train()

    for _, inputs in enumerate(epoch_iterator):

        optimizer.zero_grad()

        d1,d2,d3=inputs
       # print(len(d1))

        d1=d1.to('cuda')
        d2=d2.to('cuda')
        d3=d3.to('cuda')
        output = model(input_ids=d1, attention_mask=d2,labels=d3)

        batch_loss=output[0]

        batch_loss.backward()

        optimizer.step()

        scheduler.step()

        train_loss+=batch_loss.item()

        epoch_iterator.set_description('(batch loss=%g)' % batch_loss.item())

        del batch_loss
     #   print(training_steps_per_epoch)

    train_loss_1.append(train_loss/training_steps_per_epoch)

    print(f'Average train loss per example={train_loss/training_steps_per_epoch} in epoch{epoch+1}')
    print(f'Starting evaluate after epoch {epoch+1}')

    eval_loss=[]
    model.eval()
    for inputs in tqdm(valid_dataloader, desc="eval"):
        d1,d2,d3=inputs
        d1=d1.to('cuda')
        d2=d2.to('cuda')
        d3=d3.to('cuda')
        with torch.no_grad():
            output = model(input_ids=d1, attention_mask=d2,labels=d3)
            batch_loss=output[0]
        eval_loss+=[batch_loss.cpu().item()]
        del batch_loss

    eval_loss=np.mean(eval_loss)

    perplexity=math.exp(eval_loss)

    eval_loss_1.append(eval_loss)
    perplexity_1.aapend(perplexity)

    print(f'Average valid loss per example={eval_loss} in epoch{epoch+1}')
    print(f'Perplextiy for valid dataset in epoch{epoch+1} is {perplexity}')
Yes, your code look correct since you are zeroing out the gradients before calculating them in the backward operation and before updating the parameters in the step() call.
is it important where put model.train(), can I put it at the beginning before starting for epochs?
Yes, you should call model.train() before the training loop starts. Your code looks also correct in this manner.
@ptrblck Sorry, If I want to use training and validating in this way, how I can send my model and datasets to the cuda for the process? should I send the tokenizer, data_collator as well? which of them should be passed? I really appreciate your idea.
training_args = TrainingArguments(
   output_dir=output_dir,
   learning_rate=learning_rate,
   per_device_train_batch_size=per_device_train_batch_size,
   per_device_eval_batch_size=per_device_eval_batch_size,
   num_train_epochs=num_train_epochs,
   weight_decay=weight_decay,
   save_strategy="epoch"
)

trainer = Trainer(
   model=model,
   args=training_args,
   train_dataset=tokenized_train,
   eval_dataset=tokenized_test,
   tokenizer=tokenizer,
   data_collator=data_collator,
   compute_metrics=compute_metrics,
)
I don’t know where the Trainer class is defined and would guess it’s coming from HuggingFace, Lightning, or another higher-level API.
In plain PyTorch you would move the model and input/target tensors to the device explicitly via:
device = "cuda"
model.to(device)
data = data.to(device)
...
I don’t know if the Trainer class is supposed to transfer the data to the GPU for you or not so you might need to read the docs of this class in the corresponding library.