I want to visualize predicted output from the image.
I set the dimension of original image data, ground truth mask data, and predicted data and plot it using matplotlib.
but I don’t know why dimension error occurs.
any idea?
r = random.randint(0, 3607)
gen = BasicDataset('/home/intern/Desktop/YH/Brain_MRI/BrainMRI_train/MRI/MRI/', '/home/intern/Desktop/YH/Brain_MRI/BrainMRI_train/mask/mask/')
x, y = gen.__getitem__(r)
img = x
mask = y["masks"]
img = np.transpose(img, (1, 2, 0))
mask = mask.numpy()
mask = np.transpose(mask, (1, 2, 0))
fig = plt.figure()
fig.subplots_adjust(hspace=0.4, wspace=0.4)
ax = fig.add_subplot(1, 3, 1)
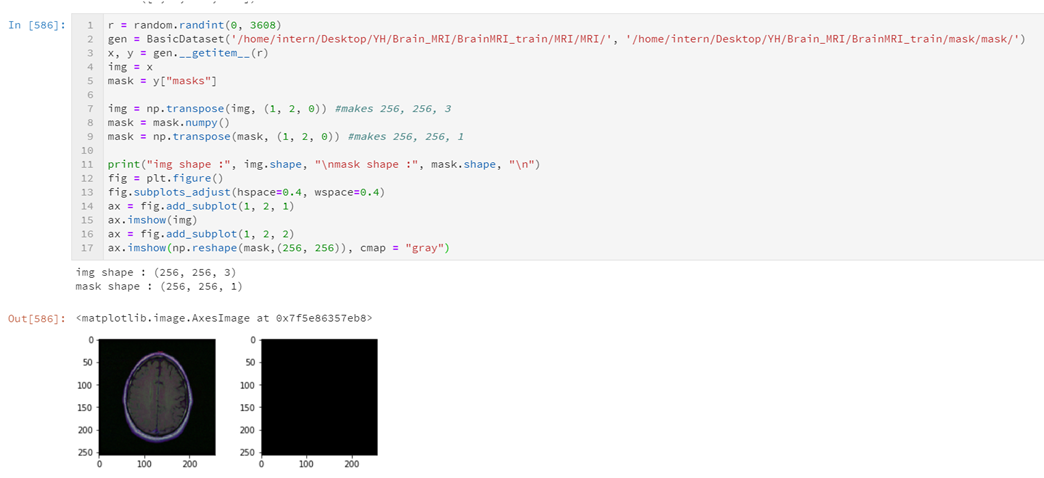
print("img shape : ", img.shape) #shape just before imshow()
ax.imshow(img)
ax = fig.add_subplot(1, 3, 2)
print("mask shape: ", mask.shape)
ax.imshow(np.reshape(mask,(256, 256)), cmap = "gray")
img = np.transpose(img, (2, 0, 1))
img = np.expand_dims(img, axis=0)
img = torch.cuda.FloatTensor(img)
#normalize
img = img/255
mask = mask/255
model.eval()
for param in model.parameters():
param.requires_grad = False
test = model(img)
test = test.to("cpu")
test = test.numpy()
test = np.squeeze(test, 0)
test = np.transpose(test, (1, 2, 0))
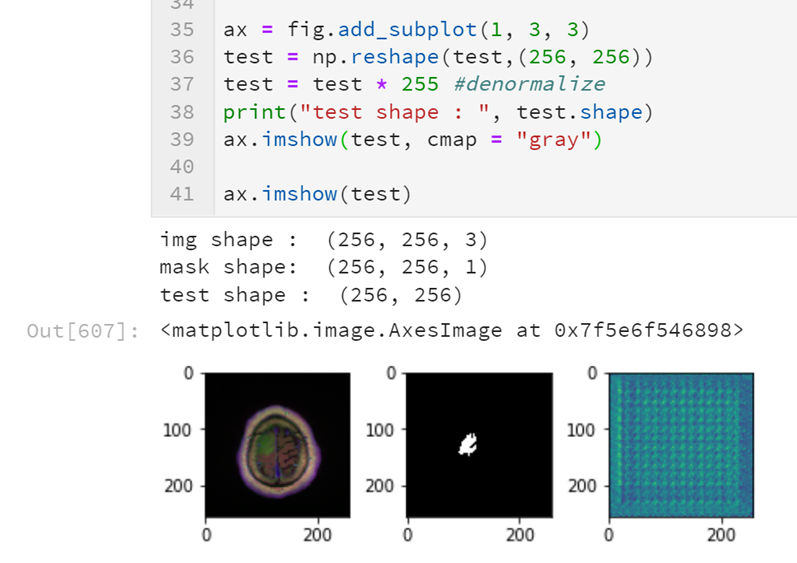
print("test shape : ", test.shape)
ax = fig.add_subplot(1, 3, 3)
ax.imshow(np.reshape(test,(256, 256)), cmap = "gray")
ax.imshow(test)
out
img shape :  (256, 256, 3)
mask shape:  (256, 256, 1)
test shape :  (256, 256, 1)
---------------------------------------------------------------------------
TypeError                                 Traceback (most recent call last)
<ipython-input-569-83fe8fe6e4e8> in <module>()
     37 ax = fig.add_subplot(1, 3, 3)
     38 ax.imshow(np.reshape(test,(256, 256)), cmap = "gray")
---> 39 ax.imshow(test)

/usr/local/lib/python3.5/dist-packages/matplotlib/__init__.py in inner(ax, *args, **kwargs)
   1853                         "the Matplotlib list!)" % (label_namer, func.__name__),
   1854                         RuntimeWarning, stacklevel=2)
-> 1855             return func(ax, *args, **kwargs)
   1856
   1857         inner.__doc__ = _add_data_doc(inner.__doc__,

/usr/local/lib/python3.5/dist-packages/matplotlib/axes/_axes.py in imshow(self, X, cmap, norm, aspect, interpolation, alpha, vmin, vmax, origin, extent, shape, filternorm, filterrad, imlim, resample, url, **kwargs)
   5485                               resample=resample, **kwargs)
   5486
-> 5487         im.set_data(X)
   5488         im.set_alpha(alpha)
   5489         if im.get_clip_path() is None:

/usr/local/lib/python3.5/dist-packages/matplotlib/image.py in set_data(self, A)
    651         if not (self._A.ndim == 2
    652                 or self._A.ndim == 3 and self._A.shape[-1] in [3, 4]):
--> 653             raise TypeError("Invalid dimensions for image data")
    654
    655         if self._A.ndim == 3:

TypeError: Invalid dimensions for image data
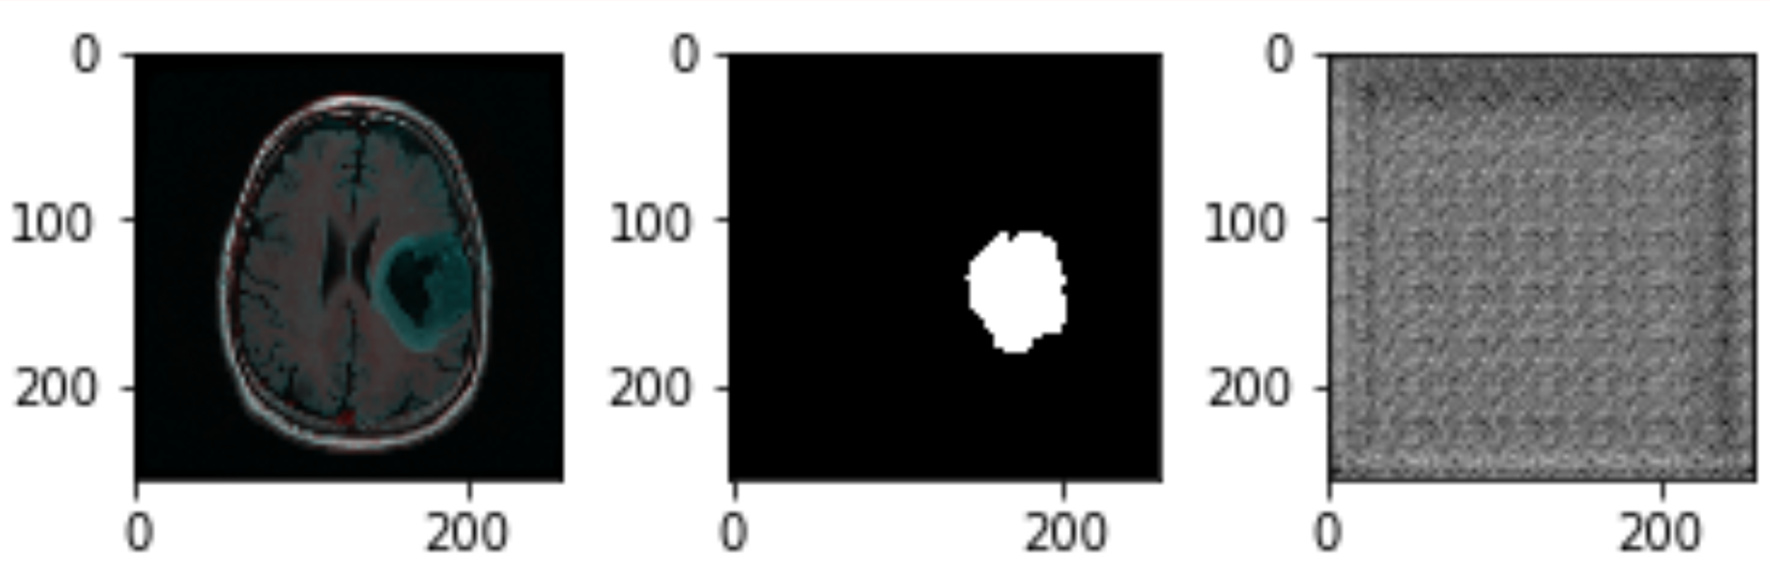
even though there was an error I could still get image.