Below code outputs the result of a single convolution. I’m attempting to maintain the result of each convolution into a valid pixel range : [0 - 255] . But after the convolution some values drop below 0. Why is the model changing the pixel range ? Can a valid parameter range value be maintained as part of training ? The reason for this implementation is I’m attempting to understand how modifying convolution parameters modifies the intermediary learned features.
%reset -f

import torch
import torch.nn.functional as F
import numpy as np
from PIL import Image
import torch.nn as nn
import torchvision
import torchvision.transforms as transforms

width = 60
height = 30

img = Image.new('RGB', (width, height), color = 'red')

in_channels = 3
out_channels = 3

class ConvNet(nn.Module):
    def __init__(self):
        super(ConvNet, self).__init__()
        self.layer1 = nn.Sequential(
            nn.Conv2d(in_channels, out_channels, kernel_size=5, stride=2, padding=2))

    def forward(self, x):
        out = self.layer1(x)

        return out

model = ConvNet()

criterion = nn.CrossEntropyLoss()
optimizer = torch.optim.Adam(model.parameters(), lr=.001)

img_a = np.array(img)

print(np.amin(img_a.flatten('F')))

img_pt = torch.tensor(img_a).float()
result = model(img_pt.view(3, width , height).unsqueeze_(0))
an = result.view(30 , 15 , out_channels).data.numpy()

print(np.amin(an.flatten('F')))
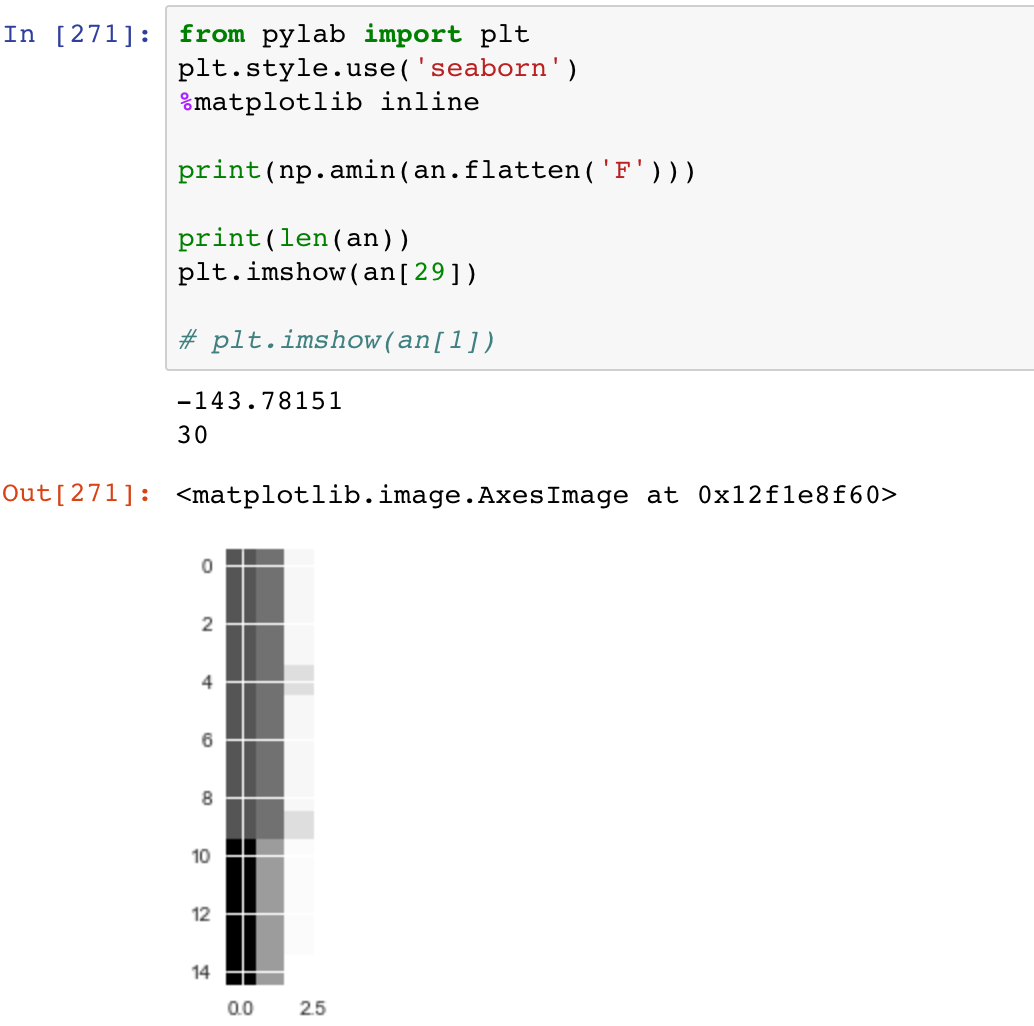
I then use below code to visualize a result :
from pylab import plt
plt.style.use(‘seaborn’)
%matplotlib inlineprint(np.amin(an.flatten(‘F’)))
print(len(an))
plt.imshow(an[29])