Hi, I have extracted the features of cifar10 and cifar100 datasets using Resnet 18. Feature embedding is stored in the file feature_embeddings.pth. Just wondering if any one can help to visualise the features using TSNE.
You could load the data via torch.load, transform it to a numpy array via arr = tensor.numpy(), and use e.g. sklearn.manifold.TSNE to visualize it.
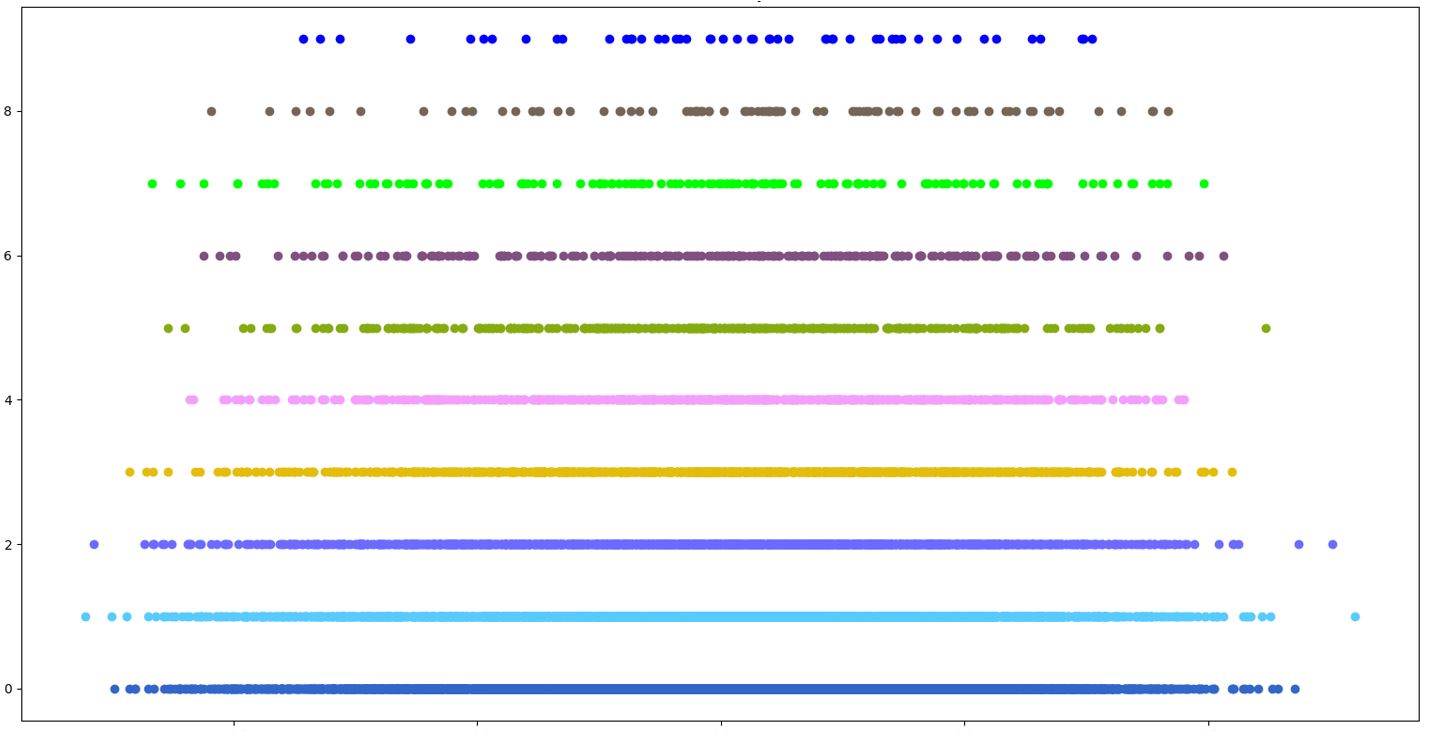
Thanks so much, Ptrblck for the help. I managed to do that as per your instructions, however, the displayed features appear on the corresponding class indices in a straight line (figure given below) instead of clusters. Moreover, these features are from the 1st epoch and are generated at runtime. I have already an embedded feature file (feature.pth) for all epochs, could you please guide how to use this file to display the features in a clustered display.
Cheers.
I’m not sure what exactly is causing this behavior, but you might want to play around with hyperparameters in TSNE, as it could show different outputs based on its setup.
E.g. the paper and conclusions mentioned in this tweet might be interesting for you to check out.