I was going through the following wonderful Colab Notebook,
PyTorch3D · A library for deep learning with 3D data
This colab only has the code without the outputs. My personal copy of this Colab Notebook with outputs can be found below,
Copy of render_textured_meshes.ipynb - Colaboratory (google.com)
And when I executed the cell
plt.figure(figsize=(7,7))
texture_image=mesh.textures.maps_padded()
plt.imshow(texture_image.squeeze().cpu().numpy())
plt.grid("off");
plt.axis("off");
It gave the following output,

and when I ran the following cell,
plt.figure(figsize=(7,7))
texturesuv_image_matplotlib(mesh.textures, subsample=None)
plt.grid("off");
plt.axis("off");
it gave the folowing,
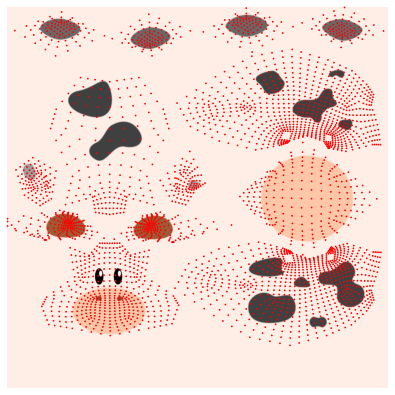
Can someone explain what these output images mean or denote?
Thankyou very much.