Visualizing the VOC Dataset

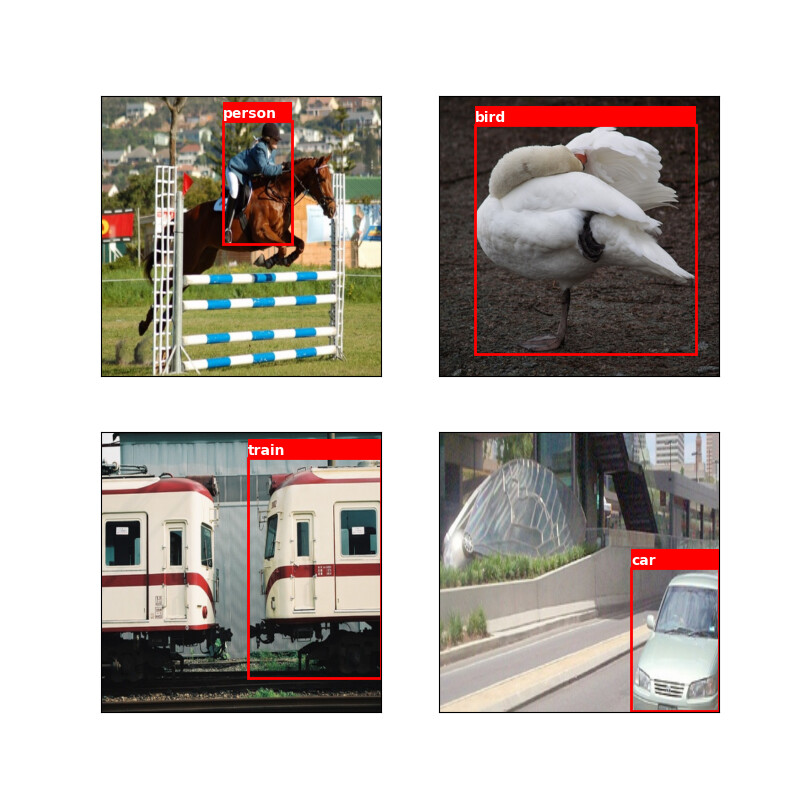
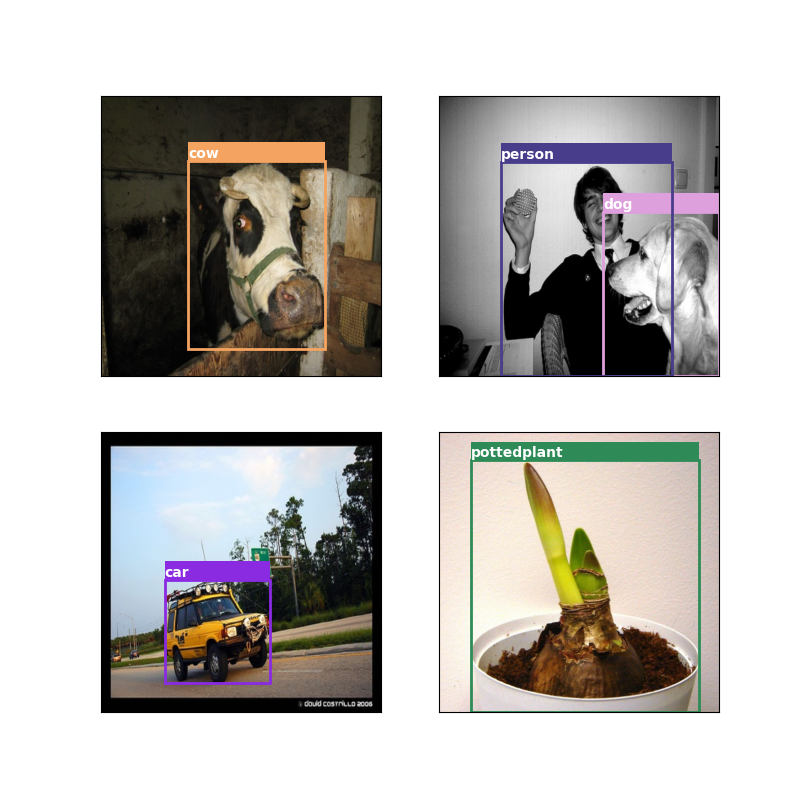
I’m trying to plot the bounding boxes of a few sample images from the VOC Dataset. The bounding boxes are in the form (x_mid, y_mid, width, height) and they are all fractional (fraction of the original image width and height).

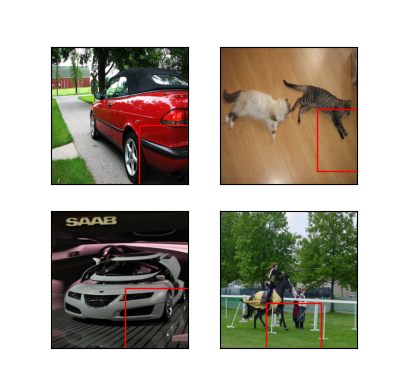
My plot currently looks like this and I don’t know why. It could be because I need to adjust the labels (since the images are being resized), but my understanding is that I don’t, since they are fractions and not absolute values. But I’m not sure.

A few notes:

  1. The csv file is a list of (img_file_name.jpg, labels_file_name.txt) entries
  2. The labels are of the form (class, x_mid, y_mid, width, height)
  3. There could be multiple labels / bounding boxes. My script just looks at the very first bounding box of each data point.

plot

And here’s the code

    import torch
    import matplotlib.pyplot as plt
    import matplotlib.patches as patches
    from torch.utils.data import Dataset, DataLoader
    from PIL import Image
    from torchvision import transforms
    import os
    import pandas as pd

    class VOCDataset(Dataset):
        """Some Information about VOCDataset"""
        def __init__(self, annotations_path, img_dir, label_dir, transforms, reshape_height, reshape_width):
            self.annotations = pd.read_csv(annotations_path)
            self.img_dir = img_dir
            self.label_dir = label_dir
            self.transforms = transforms
            self.new_height = reshape_height
            self.new_width = reshape_width
            super(VOCDataset, self).__init__()

        def __getitem__(self, index):
            img_file_name = self.annotations.iloc[index][0];
            img_file_path = os.path.join(self.img_dir, img_file_name)
            img = Image.open(img_file_path)
            # original_height, original_width = img.size
            # HEIGHT_RATIO, WIDTH_RATIO = self.new_height / original_height, self.new_width / original_width
            # print("Old shape: ", original_height, original_width)
            # print("New shape: ", self.new_height, self.new_width)
            # print(HEIGHT_RATIO, WIDTH_RATIO)
            tensor_img = self.transforms(img)

            label_file_name = self.annotations.iloc[index][1];
            label_file_path = os.path.join(self.label_dir, label_file_name)
            label = list()
            with open(label_file_path, "r") as f:
                line = f.readlines()[0]
                label = [int(float(i)) if int(float(i)) == float(i) else float(i) for i in line.split(" ")]
                # label[1] *= WIDTH_RATIO
                # label[2] *= HEIGHT_RATIO
                # label[3] *= WIDTH_RATIO
                # label[4] *= HEIGHT_RATIO
            # print(labels[0])
            return tensor_img, torch.tensor(label)

        def __len__(self):
            return len(self.annotations)

    def visualize_imgs(imgs, label, rows, cols):
        imgs = imgs.detach().numpy().transpose(0, 2, 3, 1)
        label = label.detach().numpy()
        fig = plt.figure(figsize=(5, 5))
        for i in range(imgs.shape[0]):
            ax = fig.add_subplot(rows, cols, i + 1, xticks=[], yticks=[])
            x_mid, y_mid, width, height = [448 * i for i in label[i][1:]]
            rect = patches.Rectangle((x_mid, y_mid), width, height, edgecolor='r', facecolor='none')
            ax.imshow(imgs[i])
            ax.add_patch(rect)
        plt.show()

    if __name__ == '__main__':

        IMG_DIR = "G:/dl_projects/yolov3_aladdin/PASCAL_VOC/images"
        LABEL_DIR = "G:/dl_projects/yolov3_aladdin/PASCAL_VOC/labels"
        BATCH_SIZE = 4
        NUM_WORKERS = 1
        PIN_MEMORY = False
        TRANSFORMS = transforms.Compose([
            transforms.Resize((448, 448)),
            transforms.ToTensor(),
        ])

        train_dataset = VOCDataset(
            "G:/dl_projects/yolov3_aladdin/PASCAL_VOC/8examples.csv",
            img_dir=IMG_DIR,
            label_dir=LABEL_DIR,
            transforms=TRANSFORMS,
            reshape_height=448,
            reshape_width=448
        )

        train_loader = DataLoader(
            dataset=train_dataset,
            batch_size=BATCH_SIZE,
            num_workers=NUM_WORKERS,
            pin_memory=PIN_MEMORY,
            shuffle=True,
            drop_last=True,
        )

        it = iter(train_loader)

        imgs, labels = next(it)

        visualize_imgs(imgs, labels, rows=2, cols=2)


The issue is now fixed. Turns out the matplotlib patches function to plot the bounding box takes the top-left coordinates of the bounding box along with the width and height. I’ve been passing in mid-point coordinates of the box when I really should have been passing in the top-left coordinates (even-though the width and height were being passed correctly!).

I’ve made the correction, along with a little rectangle to show labels, and now the plots look like this.

And here’s the fixed code:

import torch
import matplotlib.pyplot as plt
import matplotlib.patches as patches
from torch.utils.data import Dataset, DataLoader
from PIL import Image
from torchvision import transforms
import os
import pandas as pd

class VOCDataset(Dataset):
    """Some Information about VOCDataset"""
    def __init__(self, annotations_path, img_dir, label_dir, transforms, reshape_height, reshape_width):
        self.annotations = pd.read_csv(annotations_path)
        self.img_dir = img_dir
        self.label_dir = label_dir
        self.transforms = transforms
        self.new_height = reshape_height
        self.new_width = reshape_width
        super(VOCDataset, self).__init__()

    def __getitem__(self, index):
        img_file_name = self.annotations.iloc[index][0];
        img_file_path = os.path.join(self.img_dir, img_file_name)
        img = Image.open(img_file_path)
        tensor_img = self.transforms(img)

        label_file_name = self.annotations.iloc[index][1];
        label_file_path = os.path.join(self.label_dir, label_file_name)
        label = list()
        with open(label_file_path, "r") as f:
            line = f.readlines()[0]
            label = [int(float(i)) if int(float(i)) == float(i) else float(i) for i in line.split(" ")]
        return tensor_img, torch.tensor(label)

    def __len__(self):
        return len(self.annotations)

def visualize_imgs(imgs, label, rows, cols):
    VOC_CLASSES = ["aeroplane", "bicycle", "bird", "boat", "bottle", "bus", "car", "cat", "chair", "cow", "diningtable", 
                    "dog","horse", "motorbike", "person", "pottedplant", "sheep", "sofa", "train", "tvmonitor"]
    imgs = imgs.detach().numpy().transpose(0, 2, 3, 1)
    label = label.detach().numpy()
    fig = plt.figure(figsize=(8, 8))
    for i in range(imgs.shape[0]):
        ax = fig.add_subplot(rows, cols, i + 1, xticks=[], yticks=[])

        # to plot the bounding box
        label[i][1] -= (label[i][3] / 2)
        label[i][2] -= (label[i][4] / 2)
        top, left, width, height = [448*i for i in label[i][1:]]
        rect = patches.Rectangle((top, left), width, height, edgecolor='r', facecolor='none', linewidth=2.0)
        ax.add_patch(rect)

        # to plot a little rectangle on top of the bounding box
        LABEL_RECT_HEIGHT = 30
        label_rect = patches.Rectangle((top, left - LABEL_RECT_HEIGHT), width, LABEL_RECT_HEIGHT, facecolor='red', linewidth=2.0)
        ax.add_patch(label_rect)

        ax.text(top, left, VOC_CLASSES[int(label[i][0])], horizontalalignment='left', verticalalignment='bottom', color='white', weight='bold')
        ax.imshow(imgs[i], origin='upper')
    plt.show()

if __name__ == '__main__':

    IMG_DIR = "G:/dl_projects/yolov3_aladdin/PASCAL_VOC/images"
    LABEL_DIR = "G:/dl_projects/yolov3_aladdin/PASCAL_VOC/labels"
    BATCH_SIZE = 4
    NUM_WORKERS = 1
    PIN_MEMORY = False
    TRANSFORMS = transforms.Compose([
        transforms.Resize((448, 448)),
        transforms.ToTensor(),
    ])

    train_dataset = VOCDataset(
        "G:/dl_projects/yolov3_aladdin/PASCAL_VOC/100examples.csv",
        img_dir=IMG_DIR,
        label_dir=LABEL_DIR,
        transforms=TRANSFORMS,
        reshape_height=448,
        reshape_width=448
    )

    train_loader = DataLoader(
        dataset=train_dataset,
        batch_size=BATCH_SIZE,
        num_workers=NUM_WORKERS,
        pin_memory=PIN_MEMORY,
        shuffle=True,
        drop_last=True,
    )

    it = iter(train_loader)
    imgs, labels = next(it)
    visualize_imgs(imgs, labels, rows=2, cols=2)

Update: So I’ve extended the script to now plot all the bounding boxes in an image. I did this using a collate function to glue together all the varying number of bounding box descriptions per image.
Might be helpful for beginners like me in the future looking to visualize bounding box data.

Would love to hear your thoughts on making this script more efficient!
Here’s how the plot looks like now:

And as always, here’s the updated code:

import torch
import matplotlib.pyplot as plt
import matplotlib.patches as patches
from torch.utils.data import Dataset, DataLoader
import torch.nn.functional as F
from PIL import Image
from torchvision import transforms
import os
import pandas as pd
from torchvision.transforms.functional import pad

class VOCDataset(Dataset):
    """Some Information about VOCDataset"""
    def __init__(self, annotations_path, img_dir, label_dir, transforms):
        self.annotations = pd.read_csv(annotations_path)
        self.img_dir = img_dir
        self.label_dir = label_dir
        self.transforms = transforms
        super(VOCDataset, self).__init__()

    def __len__(self):
        return len(self.annotations)

    def __getitem__(self, index):
        img_file_name = self.annotations.iloc[index][0];
        img_file_path = os.path.join(self.img_dir, img_file_name)
        img = Image.open(img_file_path)
        tensor_img = self.transforms(img)

        label_file_name = self.annotations.iloc[index][1];
        label_file_path = os.path.join(self.label_dir, label_file_name)
        label = list()
        with open(label_file_path, "r") as f:
            labels = list()
            for line in f.readlines():
                label = [int(float(i)) if int(float(i)) == float(i) else float(i) for i in line.split(" ")]
                labels.append(label)
            tensor_labels = torch.tensor(labels)

        return (tensor_img, tensor_labels)

# The number of bouding boxes inside an image is not uniform
# So we need to build a custom collate function that allows us to glue the varying bbox list size inside a batch
def collate_VOC(batch):
    imgs = [item[0] for item in batch]
    labels = [item[1] for item in batch]

    # find the max number of bounding boxes an image has
    max_len = 1
    for item in labels:
        max_len = max(max_len, item.shape[0])
    
    # for each item (a 2d tensor where each row is a bbox) in labels, pad it with rows of 0 to the max_len of batch.
    for idx, item in enumerate(labels):
        labels[idx] = F.pad(input=labels[idx], pad=(0, 0, 0, max_len - labels[idx].shape[0]))
    
    # return the now "glu-able" labels 
    # [note that images were gluable before, since they were already being resized in the Dataset class]
    return torch.stack(imgs), torch.stack(labels)

def plot_bbox(label, ax, img_height, img_width):
    VOC_CLASSES = ["aeroplane", "bicycle", "bird", "boat", "bottle", "bus", "car", "cat", "chair", "cow", "diningtable", 
                    "dog","horse", "motorbike", "person", "pottedplant", "sheep", "sofa", "train", "tvmonitor"]
    VOC_COLORS = ["#3d9121", "#349180", "#32CD32", "#228B22", "#800000", "#FFDEAD", "#8A2BE2", "#DC143C", "#9370DB",
                    "#F4A460", "#8B4513", "#DDA0DD", "#FF69B4", "#DB7093", "#483D8B", "#2E8B57", "#00FA9A", "#8B008B", "#000080", "#8B0000"]
    # to plot the bounding box
    label[1] -= (label[3] / 2)
    label[2] -= (label[4] / 2)
    # rescaling fractional dimensions to scaled integer dimensions
    for j in range(5):
        # to skip over the class label (since that's at index 0)
        if j:
            if j % 2:
                label[j] *= img_width
            else:
                label[j] *= img_height

    left, top, width, height = [val for val in label[1:]]
    rect = patches.Rectangle((left, top), width, height, edgecolor=VOC_COLORS[int(label[0])], facecolor='none', linewidth=2.0)
    ax.add_patch(rect)

    # to plot a little rectangle on the top-left corner of the bounding box
    LABEL_RECT_HEIGHT = 30
    label_rect = patches.Rectangle((left, top - LABEL_RECT_HEIGHT), width, LABEL_RECT_HEIGHT, facecolor=VOC_COLORS[int(label[0])], linewidth=2.0)
    ax.add_patch(label_rect)
    ax.text(left, top, VOC_CLASSES[int(label[0])], horizontalalignment='left', verticalalignment='bottom', color='white', weight='bold')


def visualize_imgs(imgs, labels, rows, cols, img_height, img_width):
    imgs = imgs.detach().numpy().transpose(0, 2, 3, 1)
    labels = labels.detach().numpy()
    fig = plt.figure(figsize=(8, 8))
    for i in range(imgs.shape[0]):
        ax = fig.add_subplot(rows, cols, i + 1, xticks=[], yticks=[])

        bbox_list = labels[i]
        for bbox in bbox_list:
            # if the bbox has zero width or height, we know it's just a padding bbox
            if not bbox[3] or not bbox[4]:
                break
            else:
                plot_bbox(bbox, ax, img_height=img_height, img_width=img_width)
        
        ax.imshow(imgs[i], origin='upper')
    plt.show()

if __name__ == '__main__':

    IMG_DIR = "G:/dl_projects/yolov3_aladdin/PASCAL_VOC/images"
    LABEL_DIR = "G:/dl_projects/yolov3_aladdin/PASCAL_VOC/labels"
    BATCH_SIZE = 4
    NUM_WORKERS = 1
    PIN_MEMORY = False
    TRANSFORMS = transforms.Compose([
        transforms.Resize((448, 448)),
        transforms.ToTensor(),
    ])

    train_dataset = VOCDataset(
        "G:/dl_projects/yolov3_aladdin/PASCAL_VOC/100examples.csv",
        img_dir=IMG_DIR,
        label_dir=LABEL_DIR,
        transforms=TRANSFORMS,
    )

    train_loader = DataLoader(
        dataset=train_dataset,
        batch_size=BATCH_SIZE,
        num_workers=NUM_WORKERS,
        pin_memory=PIN_MEMORY,
        collate_fn=collate_VOC,
        shuffle=True,
        drop_last=True,
    )

    it = iter(train_loader)
    imgs, labels = next(it)
    visualize_imgs(
        imgs, 
        labels, 
        rows=2, 
        cols=2,
        img_height=448,
        img_width=448
    )