If I run the following code:
def main(batchSize, workerCount):

    # cut out df creation

    X = df[['NDVI', 'EVI', 'NIR', 'MIR','DayOfYear']].to_numpy()
    y = df[['label']].to_numpy().ravel()
    X = torch.from_numpy(X).float()
    y = torch.from_numpy(y).long()
    dataset = TensorDataset(X, y)
    print("Created dataset")

    dataloader = DataLoader(dataset, batch_size=batchSize, shuffle=True, num_workers=workerCount)
    print("Created dataloader")

    class Net(torch.nn.Module):
        def __init__(self):

            super(Net, self).__init__()
            self.fc1 = torch.nn.Linear(5, 256)
            self.fc2 = torch.nn.Linear(256, 128)
            self.fc3 = torch.nn.Linear(128, 64)
            self.fc4 = torch.nn.Linear(64, 32)
            self.fc5 = torch.nn.Linear(32, 10)
        def forward(self, x):
            x = torch.nn.functional.relu(self.fc1(x))
            x = torch.nn.functional.relu(self.fc2(x))
            x = torch.nn.functional.relu(self.fc3(x))
            x = torch.nn.functional.relu(self.fc4(x))
            x = self.fc5(x)
            return x
    print("Created net")

    torch.cuda.init()
    print("Initialized CUDA")

    # create device
    device = torch.device('cuda' if torch.cuda.is_available() else 'cpu')

    # Print available VRAM
    print(f'Available VRAM: {torch.cuda.get_device_properties(0).total_memory / 1024 ** 3} GB')
    net = Net().to(device)

    for p in net.parameters():
        # get name of device of the index of the parameter
        print(torch.cuda.get_device_name(p.device.index))

    criterion = torch.nn.CrossEntropyLoss()
    optimizer = torch.optim.Adam(net.parameters(), lr=0.001)
    print("Model training started")

    for epoch in range(50):
        for i, (inputs, labels) in enumerate(dataloader):
            inputs, labels = inputs.to(device), labels.to(device)
            optimizer.zero_grad()
            outputs = net(inputs)
            loss = criterion(outputs, labels)
            loss.backward()
            optimizer.step()
            # print name of gpu in use
            print(torch.cuda.get_device_name(inputs.device.index))
            print(f'Epoch {epoch + 1} loss: {loss.item()}')
            # vram in use
            print(f'VRAM in use: {torch.cuda.memory_allocated(0) / 1024 ** 3} GB')
    X_test, y_test = X[::10], y[::10]
    X_test, y_test = X_test.to(device), y_test.to(device)
    y_pred = torch.argmax(net(X_test), dim=1).cpu().numpy()

if __name__ == "__main__":
    main(16384, 0)
it reports
VRAM in use: 0.016548633575439453 GB
with a batch size of 16, and with a batch size of 16384 (chosen specificially to be ‘too large’) reports
VRAM in use: 0.01758432388305664 GB
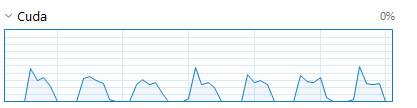
I don’t see a significant increase with increasing the number of workers. Running with 4 workers does increase CUDA usage on the performance tab of task manager to spike at ~40%, but it pauses after each epoch to the point where I’m not sure it’s any faster at all
An example debug output for the end of an epoch is
Epoch 1 loss: 1.9087867736816406
VRAM in use: 0.01770639419555664 GB
NVIDIA GeForce RTX 3070 Laptop GPU
Epoch 1 loss: 1.9021888971328735
VRAM in use: 0.01702880859375 GB
The thread 0x5 has exited with code 0 (0x0).
The thread 0x4 has exited with code 0 (0x0).
The thread 0x2 has exited with code 0 (0x0).
The thread 0x3 has exited with code 0 (0x0).
which lines up with a drop to zero in CUDA usage (each drop is the end of an epoch).
Running torch.cuda.get_device_properties(0).total_memory reports
Available VRAM: 7.99951171875 GB
so I know my GPU is visible to pytorch.
I tried increasing the general complexity of my model architecture, but that didn’t help either. The dataset being used has been heavily preprocessed in R, I tried using the original un-preprocessed dataset but that only increased the usage to
VRAM in use: 0.01770639419555664 GB
Running the unprocessed dataset, with a batch size of 16384 and 4 workers (trying my hardest to force a worst-case scenario), the results of running nvidia-smi while training are as follows:
+-----------------------------------------------------------------------------+
| NVIDIA-SMI 528.49       Driver Version: 528.49       CUDA Version: 12.0     |
|-------------------------------+----------------------+----------------------+
| GPU  Name            TCC/WDDM | Bus-Id        Disp.A | Volatile Uncorr. ECC |
| Fan  Temp  Perf  Pwr:Usage/Cap|         Memory-Usage | GPU-Util  Compute M. |
|                               |                      |               MIG M. |
|===============================+======================+======================|
|   0  NVIDIA GeForce ... WDDM  | 00000000:01:00.0 Off |                  N/A |
| N/A   59C    P5    19W / 125W |    301MiB /  8192MiB |     14%      Default |
|                               |                      |                  N/A |
+-------------------------------+----------------------+----------------------+

+-----------------------------------------------------------------------------+
| Processes:                                                                  |
|  GPU   GI   CI        PID   Type   Process name                  GPU Memory |
|        ID   ID                                                   Usage      |
|=============================================================================|
|    0   N/A  N/A      6276      C   ...oeva\anaconda3\python.exe    N/A      |
|    0   N/A  N/A     17164    C+G   ...bbwe\PaintStudio.View.exe    N/A      |
+-----------------------------------------------------------------------------+
I can provide nvidia-smi for other configurations if needed, but don’t want to clutter my question even more.
I am out of ideas on how to drag any significant GPU usage out of this code, all advice would be appreciated. Sorry this is all over the place, I wanted to cover all my attempted debugging results.