Hello,
I am profiling my training code and I’m struggling to understand the output. The different steps seem to be taking different amount of time and I am not sure why.
A simplified version of my code would be:
with profiler.profile(activities=[ProfilerActivity.CPU, ProfilerActivity.CUDA], ...) as p:
    for x, y in training_dataloader:
        p.step()
        out = model(x)
        loss = loss_fn(out,y)
        loss.backward()
        optim.step()
        optim.zero_grad()
Scheduler is set to skip_first=10, wait=5, warmup=1, active=5, repeat=1
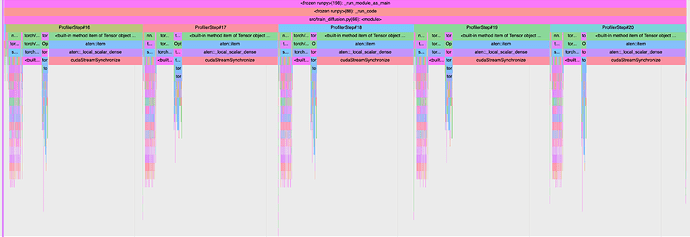
If I then add some operation that downloads something to cpu memory such as l = loss.item() after the optimizer step, I get something like this:
In both scenarios the average train step is the same even though each profiler step seems to vary in time in the first case.
I am a bit confused by this behaviour. My hypothesis is that my profiler might be measuring the async python function calls and not the actual cuda kernels. But isn’t the point of the profiler to measure the cuda kernel time? I am interested in analysing how long does my CPU and GPU take in each part of the code, and I guess here I am just seeing the CPU?
If I go down below in the GPU thread part of the profiler, I get this, which I don’t understand or is giving me too little information about how long is spent in each kernel by the gpu.
Note that this screenshot is taken for the first example where i do NOT add l = loss.item() and all the different steps are taking different time in cpu time. Yet in the GPU thread they seem to be taking the same amount of time.
I would appreciate any insights on why this is happening or if my intuitions are correct and what is the best way to measure how long is my GPU spending in each kernel.
I am using a 4090 GPU and the model is a simple UNet with 128x128 image input.
Thanks,
Benet


