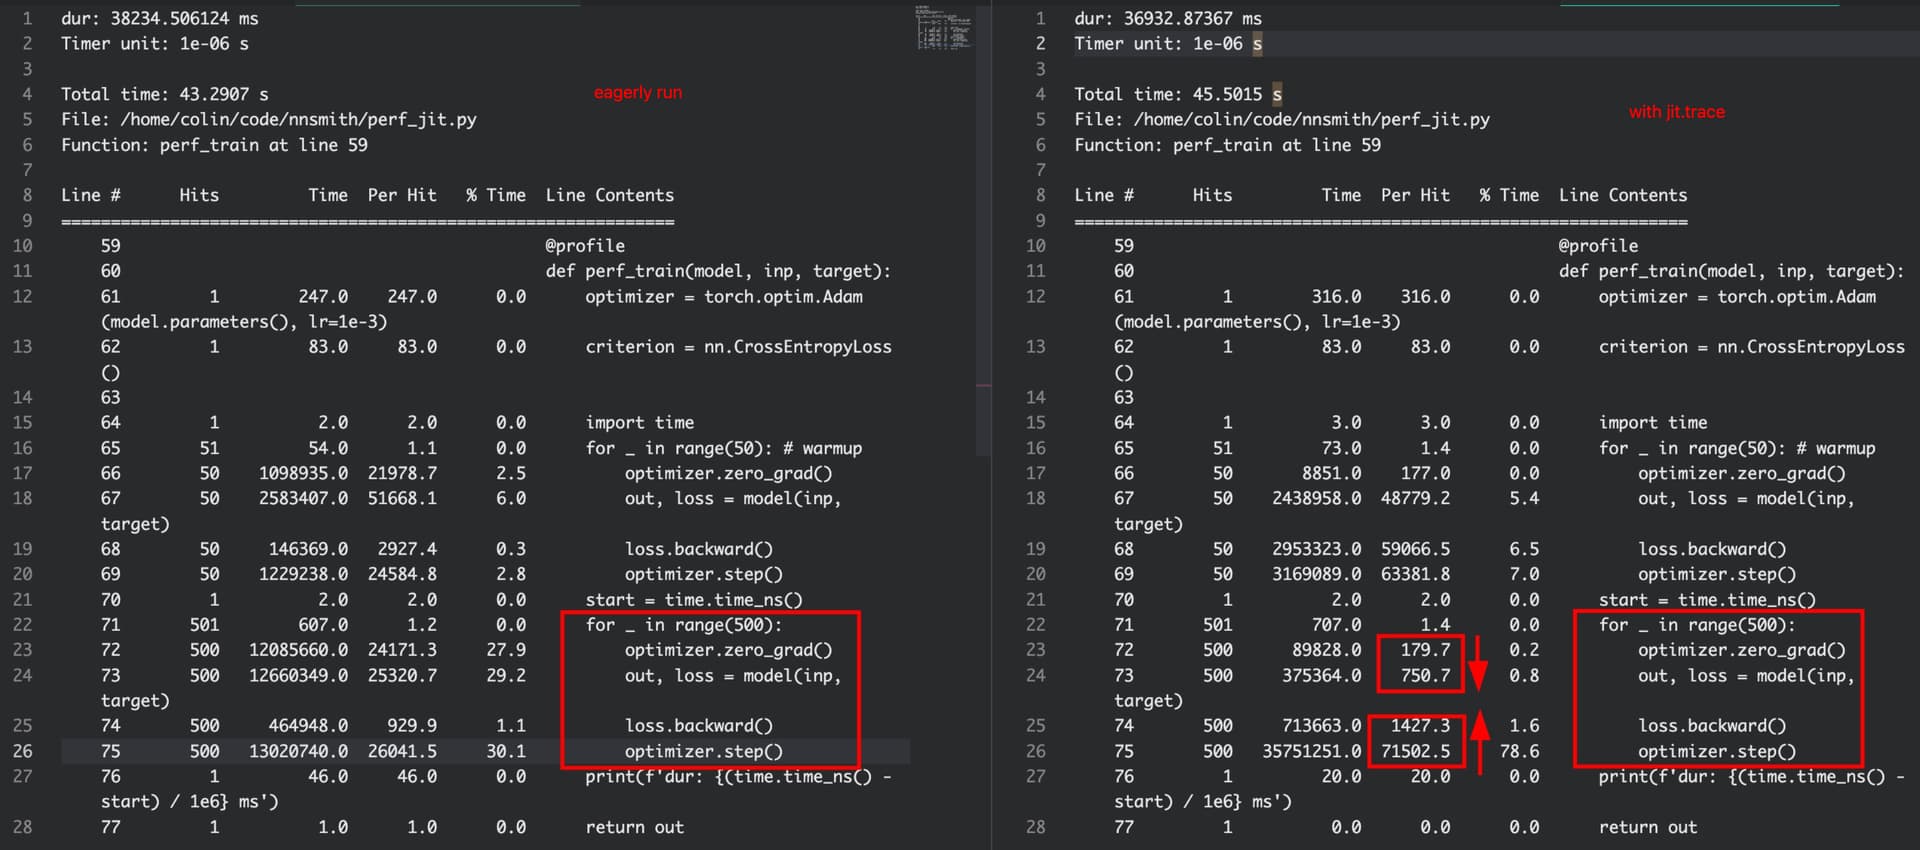
Hi all! I am trying to use JIT to speed up my training. However, when profiling my code with JIT trace, I found that while zero_grad and forward are much more faster than the case without JIT, backward and optimizer.step become slower. Why this happened? I am also wondering whether JIT compiler has some optimizations for backward and optimizer.step. I tried to search on the Internet but found nothing about this.
Profiling result:
Code to reproduce this:
import torch
import torch.nn as nn

from IPython import embed

def profile(func):
    from line_profiler import LineProfiler

    def wrapper(*args, **kwargs):
        lp = LineProfiler()
        lp_wrapper = lp(func)
        result = lp_wrapper(*args, **kwargs)
        lp.print_stats()

        return result
    return wrapper


class MyModule(nn.Module):
    def __init__(self):
        super().__init__()

        self.layers = nn.Sequential(
            nn.Conv2d(3, 64, 3, 1, 1),
            nn.BatchNorm2d(64),
            nn.ReLU(),
            nn.Conv2d(64, 64, 3, 1, 1),
            nn.BatchNorm2d(64),
            nn.ReLU(),
            nn.Conv2d(64, 32, 3, 1, 1),
            nn.BatchNorm2d(32),
            nn.ReLU(),
            nn.AvgPool2d(2, 2),
            nn.BatchNorm2d(32),
            nn.ReLU(),
            nn.Flatten(),
            nn.Linear(32*64*64, 128),
            nn.BatchNorm1d(128),
            nn.ReLU(),
            nn.Linear(128, 8),
        )
        self.loss_fn = nn.CrossEntropyLoss()

    def forward(self, x, target):
        x = self.layers(x)
        return x, self.loss_fn(x, target)


@profile
def perf_train(model, inp, target):
    optimizer = torch.optim.Adam(model.parameters(), lr=1e-3)
    criterion = nn.CrossEntropyLoss()

    import time
    for _ in range(50): # warmup
        optimizer.zero_grad()
        out, loss = model(inp, target)
        loss.backward()
        optimizer.step()
    start = time.time_ns()
    for _ in range(500):
        optimizer.zero_grad()
        out, loss = model(inp, target)
        loss.backward()
        optimizer.step()
    print(f'dur: {(time.time_ns() - start) / 1e6} ms')
    return out


def eager(perf_func):
    device = torch.device('cuda')

    mod = MyModule().to(device)
    inp = torch.randn(128, 3, 128, 128).to(device)
    target = torch.randint(0, 8, (128,)).to(inp.device)

    out = perf_func(mod, inp, target)

    # print(out.shape)


def trace(perf_func):
    device = torch.device('cuda')

    mod = MyModule().to(device)
    inp = torch.randn(128, 3, 128, 128).to(device)
    target = torch.randint(0, 8, (128,)).to(inp.device)

    traced = torch.jit.trace(mod, (inp, target))

    out = perf_func(traced, inp, target)

    # print(out.shape)

# run one of them each time
# eager(perf_train)
trace(perf_train)