Why can't this vision transformer model using timm library run on GPU?

Hello,
I recently adapted this Swin Transformer UNet

to denoise the data I use for work.
My training and evaluation code runs without error. But on my work computer with 4 NVIDIA RTX 6000 Ada GPUs, it evaluates (and trains) much more slowly than it should with volatile GPU util fluctuating between very low values like 0 to 30 % for all GPUs. Here is the evaluation code I’m using, with the classes and functions used to define the SUNet removed:

import numpy as np
import random
import torch
import torch.nn as nn
import torch.nn.functional as F
from torch.utils.data import Dataset, TensorDataset, DataLoader
from torch.utils.tensorboard import SummaryWriter
import torchvision
import torchvision.transforms as T
import torchvision.transforms.functional as TF
import nibabel as nib
from collections import OrderedDict
import matplotlib.pyplot as plt
import time
import torch.utils.checkpoint as checkpoint
from einops import rearrange
from timm.models.layers import DropPath, to_2tuple, trunc_normal_
from thop import profile
from common_functions_UnetUDenoising import loadCardiacSet, makeNormalizedHPSingularVector, create_circular_mask, make1DSeparableGaussianKernelsFor3DFilter, makeUhatLabelFromFDKMatrices, CustomDataset2D_V2, CustomTestDataset, MSEofXandUandCPlusMSEofXBlurred, make1DSeparableGaussianKernelsFor2DFilter, recoverDecompFromX, recoverPCDImagesFromUhat 

start_time = time.time()
print("Generating test set predictions")
model = SUNet(img_size=448, patch_size=4, in_chans=4, out_chans=4,
              embed_dim=96, depths=[8, 8, 8, 8],
              num_heads=[8, 8, 8, 8],
              window_size=7, mlp_ratio=4., qkv_bias=True, qk_scale=None,
              drop_rate=0., attn_drop_rate=0., drop_path_rate=0.1,
              norm_layer=nn.LayerNorm, ape=False, patch_norm=True,
              use_checkpoint=False, final_upsample="Dual up-sample")  # .cuda()

if torch.cuda.device_count() > 1:
    print("Let's use ",torch.cuda.device_count()," GPUs!")
    model = nn.DataParallel(model)

model = model.to(device)
model.load_state_dict(torch.load('runs/May10_11-32-56_secretariat-dhe-duke-eduSUNetU_MSEofXandUandCandXblurLambdOne40LambdTwo1.2_ICaWaterSensmat_6CardiacSetTrain_pSVTLabels_Cropped_bsize8_LR2em4AdamStop20/torchSUNetU_MSEofXandUandCandXblurLambdOne40LambdTwo1.2_ICaWaterSensmat_6CardiacSetTrain_pSVTLabels_Cropped_bsize8_LR2em4AdamStop20.pth'))


########## Test Sets ##########

crop = True

filename_wfbp1 = '/media/justify/Cardiac_APOE/09262023/230926-10/Results/set1/X2t.nii'
crop_start_1 = 20
crop_end_1 = 260

pcd_wfbp1 = loadCardiacSet(filename_wfbp1,crop_start_1,crop_end_1,crop)
print("loaded wFBP NIFTI file to volume")

U0, Minv, Ug, S, Vh, Winv = makeNormalizedHPSingularVector(pcd_wfbp1)

#Need to pad to axial slice size 448 x 448 for SUNet
pad = T.Pad(24)

print("Completed transformation to U domain")
U0 = torch.permute(U0,(2,3,0,1)).float()
U0 = pad(U0)
print("U0 size")
print(U0.size())    
Ug = torch.permute(torch.squeeze(Ug),(1,0,2,3)).float()
Ug = pad(Ug)
print("Ug size")
print(Ug.size())
settest= torch.zeros(U0.size(dim=0))

Minv = torch.unsqueeze(Minv,dim=0).float()
S = torch.unsqueeze(S,dim=0).float()
Vh = torch.unsqueeze(Vh,dim=0).float()
Winv = torch.unsqueeze(Winv,dim=0).float()

#in this case, I am simply plugging the input into the spot where the label is supposed to go
testDat = CustomTestDataset(U0,Ug,settest,Minv,S,Vh,Winv)
testLoader = DataLoader(testDat,batch_size=batch_size)

print("prepared data loader")

pred_iter = torch.zeros(U0.size())
pred_iter = pred_iter.to(device)

idx = 0
with torch.no_grad():
    for batch_idx,(U0b, Ugb, setsb, Minvb, Sb, Vhb, Winvb) in enumerate(testLoader):
        print(idx)
        U0b, Ugb, setsb, Minvb, Sb, Vhb, Winvb = U0b.to(device), Ugb.to(device), setsb.to(device), Minvb.to(device), Sb.to(device), Vhb.to(device), Winvb.to(device)
        Uhatb = model(U0b)
        predictX = recoverPCDImagesFromUhat(Uhatb, Ugb, setsb, Minvb, Sb, Vhb, Winvb)

        if(idx+batch_size >= pred_iter.size(dim=0)):
            pred_iter[idx:,:,:,:] = predictX
        else:
            pred_iter[idx:idx+batch_size,:,:,:] = predictX

        del predictX,U0b,Ugb

        idx = idx+batch_size


pred_iter = pred_iter.detach().to('cpu').numpy()
pred_iter = pred_iter/1000
pred_iter = np.transpose(pred_iter,(2,3,0,1))
pred_iter = np.reshape(pred_iter,(pred_iter.shape[0],pred_iter.shape[1],int(pred_iter.shape[2]/10),10,4))
pred_iter = pred_iter[24:-24,24:-24,:,:,:] #undo padding of network input

saveimg = nib.Nifti1Image(pred_iter,np.eye(4))
savepath = 'runs/May10_11-32-56_secretariat-dhe-duke-eduSUNetU_MSEofXandUandCandXblurLambdOne40LambdTwo1.2_ICaWaterSensmat_6CardiacSetTrain_pSVTLabels_Cropped_bsize8_LR2em4AdamStop20/X_230926_10_SUNetUEnergy_fortimecode_pegasus.nii'
nib.save(saveimg,savepath)

print("Done. Total time:")
print(time.time() - start_time, " seconds")

The SUNet code pasted above runs much faster on an older computer with four NVIDIA Titan Xp GPUs because the older computer has much higher volatile GPU util for this script.

In addition, if I run the exact same code on the newer computer with four RTX 6000 Ada GPUs but replace the SUNet with a simple 2D U-net CNN (which only uses torch.nn library functions) the code runs very quickly with volatile GPU util near 75 to 85% for all GPUs during evaluation.

My best guess is that there is some sort of mismatch between the timm version and the cuda version on my newer computer, although I haven’t resolved the issue so I could be wrong.

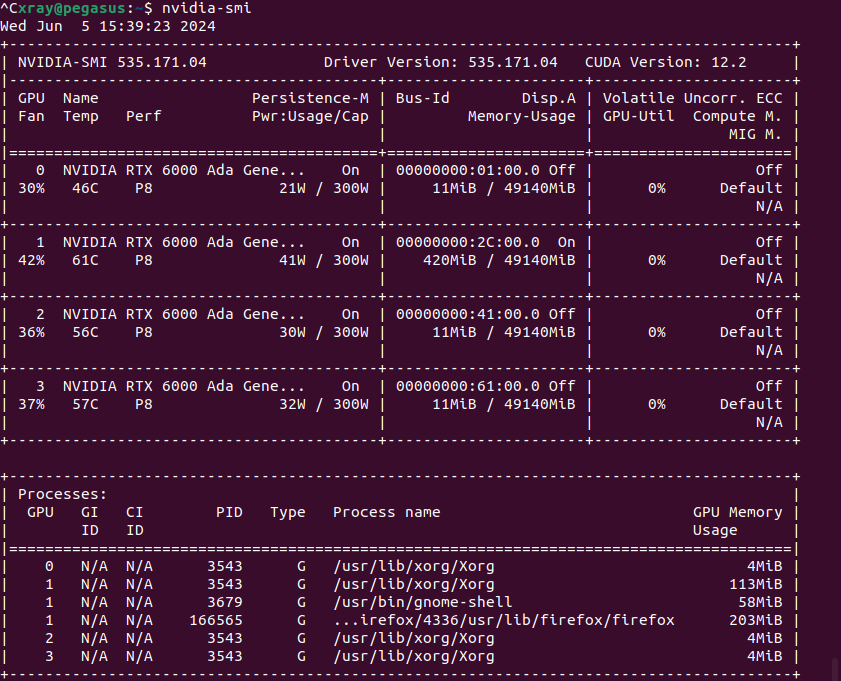
Below is more information about the newer computer on which I’m trying to improve the performance of my SUNet script.

Here is the output of nvidia-smi when I’m not running anything:

I tried running this SUNet evaluation code in 2 different environments and both environments had the same problem with GPU utilization. For both, the Python version is 3.10.12.

First, I simply did a “pip install timm” in my default environment which already had libraries such as torch installed. This default environment has:
torch version 2.2.2+cu121
torchvision version 0.17.1+cu121
timm version 0.9.12

Second, I used “python3 -m venv timmenv”, to create a new environment, activated timmenv, then pip installed timm in there and let it decide which dependencies to install. This timmenv has
torch version 2.3.0+cu121
torchvision version 0.18.0+cu121
timm version 1.0.3
An warning that occurs when evaluating SUNet only in timmenv is this:

/home/xray/timmenv/lib/python3.10/site-packages/torch/nn/modules/conv.py:456: UserWarning: Plan failed with a CuDNNError: cuDNN error: CUDNN_STATUS_BAD_PARAM
Exception raised from run_conv_plan at ../aten/src/ATen/native/cudnn/Conv_v8.cpp:374 (most recent call first):
frame #0: c10::Error::Error(c10::SourceLocation, std::string) + 0x57 (0x7f48a629e897 in /home/xray/timmenv/lib/python3.10/site-packages/torch/lib/libc10.so)
frame #1: <unknown function> + 0xe1c861 (0x7f485981c861 in /home/xray/timmenv/lib/python3.10/site-packages/torch/lib/libtorch_cuda.so)
frame #2: <unknown function> + 0x1095d83 (0x7f4859a95d83 in /home/xray/timmenv/lib/python3.10/site-packages/torch/lib/libtorch_cuda.so)
frame #3: <unknown function> + 0x1097c2c (0x7f4859a97c2c in /home/xray/timmenv/lib/python3.10/site-packages/torch/lib/libtorch_cuda.so)
frame #4: <unknown function> + 0x109817b (0x7f4859a9817b in /home/xray/timmenv/lib/python3.10/site-packages/torch/lib/libtorch_cuda.so)
frame #5: <unknown function> + 0x107aca2 (0x7f4859a7aca2 in /home/xray/timmenv/lib/python3.10/site-packages/torch/lib/libtorch_cuda.so)
frame #6: at::native::cudnn_convolution(at::Tensor const&, at::Tensor const&, c10::ArrayRef<long>, c10::ArrayRef<long>, c10::ArrayRef<long>, long, bool, bool, bool) + 0x53f (0x7f4859a7b66f in /home/xray/timmenv/lib/python3.10/site-packages/torch/lib/libtorch_cuda.so)
frame #7: <unknown function> + 0x32d0a9e (0x7f485bcd0a9e in /home/xray/timmenv/lib/python3.10/site-packages/torch/lib/libtorch_cuda.so)
frame #8: <unknown function> + 0x32e8251 (0x7f485bce8251 in /home/xray/timmenv/lib/python3.10/site-packages/torch/lib/libtorch_cuda.so)
frame #9: at::_ops::cudnn_convolution::call(at::Tensor const&, at::Tensor const&, c10::ArrayRef<c10::SymInt>, c10::ArrayRef<c10::SymInt>, c10::ArrayRef<c10::SymInt>, c10::SymInt, bool, bool, bool) + 0x2bb (0x7f488f437c2b in /home/xray/timmenv/lib/python3.10/site-packages/torch/lib/libtorch_cpu.so)
frame #10: at::native::_convolution(at::Tensor const&, at::Tensor const&, std::optional<at::Tensor> const&, c10::ArrayRef<long>, c10::ArrayRef<long>, c10::ArrayRef<long>, bool, c10::ArrayRef<long>, long, bool, bool, bool, bool) + 0x13cb (0x7f488e67280b in /home/xray/timmenv/lib/python3.10/site-packages/torch/lib/libtorch_cpu.so)
frame #11: <unknown function> + 0x2e0089f (0x7f488f80089f in /home/xray/timmenv/lib/python3.10/site-packages/torch/lib/libtorch_cpu.so)
frame #12: <unknown function> + 0x2e071fc (0x7f488f8071fc in /home/xray/timmenv/lib/python3.10/site-packages/torch/lib/libtorch_cpu.so)
frame #13: at::_ops::_convolution::call(at::Tensor const&, at::Tensor const&, std::optional<at::Tensor> const&, c10::ArrayRef<c10::SymInt>, c10::ArrayRef<c10::SymInt>, c10::ArrayRef<c10::SymInt>, bool, c10::ArrayRef<c10::SymInt>, c10::SymInt, bool, bool, bool, bool) + 0x344 (0x7f488ef496f4 in /home/xray/timmenv/lib/python3.10/site-packages/torch/lib/libtorch_cpu.so)
frame #14: at::native::convolution(at::Tensor const&, at::Tensor const&, std::optional<at::Tensor> const&, c10::ArrayRef<long>, c10::ArrayRef<long>, c10::ArrayRef<long>, bool, c10::ArrayRef<long>, long) + 0x3b8 (0x7f488e665e88 in /home/xray/timmenv/lib/python3.10/site-packages/torch/lib/libtorch_cpu.so)
frame #15: <unknown function> + 0x2e0013c (0x7f488f80013c in /home/xray/timmenv/lib/python3.10/site-packages/torch/lib/libtorch_cpu.so)
frame #16: <unknown function> + 0x2e07068 (0x7f488f807068 in /home/xray/timmenv/lib/python3.10/site-packages/torch/lib/libtorch_cpu.so)
frame #17: at::_ops::convolution::redispatch(c10::DispatchKeySet, at::Tensor const&, at::Tensor const&, std::optional<at::Tensor> const&, c10::ArrayRef<c10::SymInt>, c10::ArrayRef<c10::SymInt>, c10::ArrayRef<c10::SymInt>, bool, c10::ArrayRef<c10::SymInt>, c10::SymInt) + 0x17b (0x7f488ef0738b in /home/xray/timmenv/lib/python3.10/site-packages/torch/lib/libtorch_cpu.so)
frame #18: <unknown function> + 0x4503901 (0x7f4890f03901 in /home/xray/timmenv/lib/python3.10/site-packages/torch/lib/libtorch_cpu.so)
frame #19: <unknown function> + 0x4504879 (0x7f4890f04879 in /home/xray/timmenv/lib/python3.10/site-packages/torch/lib/libtorch_cpu.so)
frame #20: at::_ops::convolution::call(at::Tensor const&, at::Tensor const&, std::optional<at::Tensor> const&, c10::ArrayRef<c10::SymInt>, c10::ArrayRef<c10::SymInt>, c10::ArrayRef<c10::SymInt>, bool, c10::ArrayRef<c10::SymInt>, c10::SymInt) + 0x2d4 (0x7f488ef484f4 in /home/xray/timmenv/lib/python3.10/site-packages/torch/lib/libtorch_cpu.so)
frame #21: <unknown function> + 0x19bd900 (0x7f488e3bd900 in /home/xray/timmenv/lib/python3.10/site-packages/torch/lib/libtorch_cpu.so)
frame #22: at::native::conv2d_symint(at::Tensor const&, at::Tensor const&, std::optional<at::Tensor> const&, c10::ArrayRef<c10::SymInt>, c10::ArrayRef<c10::SymInt>, c10::ArrayRef<c10::SymInt>, c10::SymInt) + 0x16b (0x7f488e66976b in /home/xray/timmenv/lib/python3.10/site-packages/torch/lib/libtorch_cpu.so)
frame #23: <unknown function> + 0x2ff96c3 (0x7f488f9f96c3 in /home/xray/timmenv/lib/python3.10/site-packages/torch/lib/libtorch_cpu.so)
frame #24: <unknown function> + 0x2ff995d (0x7f488f9f995d in /home/xray/timmenv/lib/python3.10/site-packages/torch/lib/libtorch_cpu.so)
frame #25: at::_ops::conv2d::call(at::Tensor const&, at::Tensor const&, std::optional<at::Tensor> const&, c10::ArrayRef<c10::SymInt>, c10::ArrayRef<c10::SymInt>, c10::ArrayRef<c10::SymInt>, c10::SymInt) + 0x26e (0x7f488f56c95e in /home/xray/timmenv/lib/python3.10/site-packages/torch/lib/libtorch_cpu.so)
frame #26: <unknown function> + 0x6853ad (0x7f48a4a853ad in /home/xray/timmenv/lib/python3.10/site-packages/torch/lib/libtorch_python.so)
<omitting python frames>
 (Triggered internally at ../aten/src/ATen/native/cudnn/Conv_v8.cpp:921.)
  return F.conv2d(input, weight, bias, self.stride,

I would really appreciate advice on how to enable proper SUNet GPU utilization on my newer computer.

Thanks,
Rohan

Your locally installed CUDA toolkit won’t be used as PyTorch binaries ship with their own CUDA dependencies.
Also, timm does not ship with custom kernels and depends on PyTorch ops.

You should profile the code, using e.g. Nsight Systems, to narrow down the bottleneck.

Thank you for the clarification and suggestion. I haven’t done profiling of code before, so if I’m doing something wrong please point me to the example you would recommend.

Here is what I did. I found this example to be the easiest to follow:
https://pytorch.org/tutorials/recipes/recipes/profiler_recipe.html
So I modified my code like this:

with profile(activities=[ProfilerActivity.CPU, ProfilerActivity.CUDA],schedule=torch.profiler.schedule(skip_first=150,wait=1,warmup=1,active=3,repeat=5),on_trace_ready=trace_handler) as p:
    with torch.no_grad():
        for batch_idx,(U0b, Ugb, setsb, Minvb, Sb, Vhb, Winvb) in enumerate(testLoader):
            print(idx)
            U0b, Ugb, setsb, Minvb, Sb, Vhb, Winvb = U0b.to(device), Ugb.to(device), setsb.to(device), Minvb.to(device), Sb.to(device), Vhb.to(device), Winvb.to(device)
            Uhatb = model(U0b)
            predictX = recoverPCDImagesFromUhat(Uhatb, Ugb, setsb, Minvb, Sb, Vhb, Winvb)

            if(idx+batch_size >= pred_iter.size(dim=0)):
                pred_iter[idx:,:,:,:] = predictX
            else:
                pred_iter[idx:idx+batch_size,:,:,:] = predictX

            del predictX,U0b,Ugb

            idx = idx+batch_size
            p.step()

Here is the relevant part of the output to Terminal while running this code:

STAGE:2024-06-06 11:42:43 281092:281092 ActivityProfilerController.cpp:314] Completed Stage: Warm Up
1216
1224
1232
STAGE:2024-06-06 11:42:50 281092:281092 ActivityProfilerController.cpp:320] Completed Stage: Collection
STAGE:2024-06-06 11:42:50 281092:281092 ActivityProfilerController.cpp:324] Completed Stage: Post Processing
-------------------------------------------------------  ------------  ------------  ------------  ------------  ------------  ------------  ------------  ------------  ------------  ------------  
                                                   Name    Self CPU %      Self CPU   CPU total %     CPU total  CPU time avg     Self CUDA   Self CUDA %    CUDA total  CUDA time avg    # of Calls  
-------------------------------------------------------  ------------  ------------  ------------  ------------  ------------  ------------  ------------  ------------  ------------  ------------  
ncclDevKernel_Broadcast_RING_LL(ncclDevComm*, unsign...         0.00%       0.000us         0.00%       0.000us       0.000us     271.778ms        33.50%     271.778ms     647.090us           420  
                                 ampere_sgemm_128x64_tn         0.00%       0.000us         0.00%       0.000us       0.000us     135.747ms        16.73%     135.747ms      73.456us          1848  
                                ampere_sgemm_128x128_nn         0.00%       0.000us         0.00%       0.000us       0.000us      71.454ms         8.81%      71.454ms      52.929us          1350  
                                 ampere_sgemm_32x128_tn         0.00%       0.000us         0.00%       0.000us       0.000us      44.080ms         5.43%      44.080ms      72.026us           612  
void at::native::(anonymous namespace)::RowwiseMomen...         0.00%       0.000us         0.00%       0.000us       0.000us      42.550ms         5.25%      42.550ms     100.591us           423  
void at::native::elementwise_kernel<128, 2, at::nati...         0.00%       0.000us         0.00%       0.000us       0.000us      33.858ms         4.17%      33.858ms       7.103us          4767  
void at::native::elementwise_kernel<128, 2, at::nati...         0.00%       0.000us         0.00%       0.000us       0.000us      26.066ms         3.21%      26.066ms      24.068us          1083  
void at::native::(anonymous namespace)::CatArrayBatc...         0.00%       0.000us         0.00%       0.000us       0.000us      23.492ms         2.90%      23.492ms     279.667us            84  
     cudnn_infer_ampere_scudnn_128x128_relu_small_nn_v1         0.00%       0.000us         0.00%       0.000us       0.000us      18.164ms         2.24%      18.164ms     672.741us            27  
                                            aten::copy_         0.01%       1.015ms         0.18%      13.035ms     255.588us      17.363ms         2.14%      17.363ms     340.451us            51  
-------------------------------------------------------  ------------  ------------  ------------  ------------  ------------  ------------  ------------  ------------  ------------  ------------  
Self CPU time total: 7.167s
Self CUDA time total: 811.201ms

1240
1248
STAGE:2024-06-06 11:43:01 281092:281092 ActivityProfilerController.cpp:314] Completed Stage: Warm Up
1256
1264
1272
STAGE:2024-06-06 11:43:08 281092:281092 ActivityProfilerController.cpp:320] Completed Stage: Collection
STAGE:2024-06-06 11:43:08 281092:281092 ActivityProfilerController.cpp:324] Completed Stage: Post Processing
-------------------------------------------------------  ------------  ------------  ------------  ------------  ------------  ------------  ------------  ------------  ------------  ------------  
                                                   Name    Self CPU %      Self CPU   CPU total %     CPU total  CPU time avg     Self CUDA   Self CUDA %    CUDA total  CUDA time avg    # of Calls  
-------------------------------------------------------  ------------  ------------  ------------  ------------  ------------  ------------  ------------  ------------  ------------  ------------  
ncclDevKernel_Broadcast_RING_LL(ncclDevComm*, unsign...         0.00%       0.000us         0.00%       0.000us       0.000us     349.092ms        37.54%     349.092ms     831.171us           420  
                                 ampere_sgemm_128x64_tn         0.00%       0.000us         0.00%       0.000us       0.000us     135.129ms        14.53%     135.129ms      73.122us          1848  
                                ampere_sgemm_128x128_nn         0.00%       0.000us         0.00%       0.000us       0.000us      71.642ms         7.70%      71.642ms      53.068us          1350  
void at::native::(anonymous namespace)::CatArrayBatc...         0.00%       0.000us         0.00%       0.000us       0.000us      66.799ms         7.18%      66.799ms     795.226us            84  
                                 ampere_sgemm_32x128_tn         0.00%       0.000us         0.00%       0.000us       0.000us      43.927ms         4.72%      43.927ms      71.776us           612  
void at::native::(anonymous namespace)::RowwiseMomen...         0.00%       0.000us         0.00%       0.000us       0.000us      42.162ms         4.53%      42.162ms      99.674us           423  
void at::native::elementwise_kernel<128, 2, at::nati...         0.00%       0.000us         0.00%       0.000us       0.000us      33.688ms         3.62%      33.688ms       7.067us          4767  
void at::native::elementwise_kernel<128, 2, at::nati...         0.00%       0.000us         0.00%       0.000us       0.000us      25.531ms         2.75%      25.531ms      23.574us          1083  
     cudnn_infer_ampere_scudnn_128x128_relu_small_nn_v1         0.00%       0.000us         0.00%       0.000us       0.000us      18.009ms         1.94%      18.009ms     667.000us            27  
void at::native::vectorized_elementwise_kernel<4, at...         0.00%       0.000us         0.00%       0.000us       0.000us      17.633ms         1.90%      17.633ms      26.240us           672  
-------------------------------------------------------  ------------  ------------  ------------  ------------  ------------  ------------  ------------  ------------  ------------  ------------  
Self CPU time total: 7.066s
Self CUDA time total: 929.903ms

1280
1288
STAGE:2024-06-06 11:43:19 281092:281092 ActivityProfilerController.cpp:314] Completed Stage: Warm Up
1296
1304
1312
STAGE:2024-06-06 11:43:26 281092:281092 ActivityProfilerController.cpp:320] Completed Stage: Collection
STAGE:2024-06-06 11:43:26 281092:281092 ActivityProfilerController.cpp:324] Completed Stage: Post Processing
-------------------------------------------------------  ------------  ------------  ------------  ------------  ------------  ------------  ------------  ------------  ------------  ------------  
                                                   Name    Self CPU %      Self CPU   CPU total %     CPU total  CPU time avg     Self CUDA   Self CUDA %    CUDA total  CUDA time avg    # of Calls  
-------------------------------------------------------  ------------  ------------  ------------  ------------  ------------  ------------  ------------  ------------  ------------  ------------  
ncclDevKernel_Broadcast_RING_LL(ncclDevComm*, unsign...         0.00%       0.000us         0.00%       0.000us       0.000us     296.163ms        33.90%     296.163ms     705.150us           420  
                                 ampere_sgemm_128x64_tn         0.00%       0.000us         0.00%       0.000us       0.000us     134.893ms        15.44%     134.893ms      72.994us          1848  
                                ampere_sgemm_128x128_nn         0.00%       0.000us         0.00%       0.000us       0.000us      71.353ms         8.17%      71.353ms      52.854us          1350  
void at::native::(anonymous namespace)::CatArrayBatc...         0.00%       0.000us         0.00%       0.000us       0.000us      64.810ms         7.42%      64.810ms     771.548us            84  
                                 ampere_sgemm_32x128_tn         0.00%       0.000us         0.00%       0.000us       0.000us      43.953ms         5.03%      43.953ms      71.819us           612  
void at::native::(anonymous namespace)::RowwiseMomen...         0.00%       0.000us         0.00%       0.000us       0.000us      42.216ms         4.83%      42.216ms      99.801us           423  
void at::native::elementwise_kernel<128, 2, at::nati...         0.00%       0.000us         0.00%       0.000us       0.000us      33.754ms         3.86%      33.754ms       7.081us          4767  
void at::native::elementwise_kernel<128, 2, at::nati...         0.00%       0.000us         0.00%       0.000us       0.000us      25.484ms         2.92%      25.484ms      23.531us          1083  
     cudnn_infer_ampere_scudnn_128x128_relu_small_nn_v1         0.00%       0.000us         0.00%       0.000us       0.000us      18.034ms         2.06%      18.034ms     667.926us            27  
void at::native::vectorized_elementwise_kernel<4, at...         0.00%       0.000us         0.00%       0.000us       0.000us      17.073ms         1.95%      17.073ms      25.406us           672  
-------------------------------------------------------  ------------  ------------  ------------  ------------  ------------  ------------  ------------  ------------  ------------  ------------  
Self CPU time total: 7.202s
Self CUDA time total: 873.690ms

1320
1328
STAGE:2024-06-06 11:43:37 281092:281092 ActivityProfilerController.cpp:314] Completed Stage: Warm Up
1336
1344
1352
STAGE:2024-06-06 11:43:44 281092:281092 ActivityProfilerController.cpp:320] Completed Stage: Collection
STAGE:2024-06-06 11:43:44 281092:281092 ActivityProfilerController.cpp:324] Completed Stage: Post Processing
-------------------------------------------------------  ------------  ------------  ------------  ------------  ------------  ------------  ------------  ------------  ------------  ------------  
                                                   Name    Self CPU %      Self CPU   CPU total %     CPU total  CPU time avg     Self CUDA   Self CUDA %    CUDA total  CUDA time avg    # of Calls  
-------------------------------------------------------  ------------  ------------  ------------  ------------  ------------  ------------  ------------  ------------  ------------  ------------  
ncclDevKernel_Broadcast_RING_LL(ncclDevComm*, unsign...         0.00%       0.000us         0.00%       0.000us       0.000us     274.743ms        32.25%     274.743ms     654.150us           420  
                                 ampere_sgemm_128x64_tn         0.00%       0.000us         0.00%       0.000us       0.000us     177.994ms        20.89%     177.994ms      96.317us          1848  
                                ampere_sgemm_128x128_nn         0.00%       0.000us         0.00%       0.000us       0.000us      70.929ms         8.33%      70.929ms      52.540us          1350  
                                 ampere_sgemm_32x128_tn         0.00%       0.000us         0.00%       0.000us       0.000us      43.807ms         5.14%      43.807ms      71.580us           612  
void at::native::(anonymous namespace)::RowwiseMomen...         0.00%       0.000us         0.00%       0.000us       0.000us      41.694ms         4.89%      41.694ms      98.567us           423  
void at::native::elementwise_kernel<128, 2, at::nati...         0.00%       0.000us         0.00%       0.000us       0.000us      33.700ms         3.96%      33.700ms       7.069us          4767  
void at::native::elementwise_kernel<128, 2, at::nati...         0.00%       0.000us         0.00%       0.000us       0.000us      25.493ms         2.99%      25.493ms      23.539us          1083  
void at::native::(anonymous namespace)::CatArrayBatc...         0.00%       0.000us         0.00%       0.000us       0.000us      23.160ms         2.72%      23.160ms     275.714us            84  
     cudnn_infer_ampere_scudnn_128x128_relu_small_nn_v1         0.00%       0.000us         0.00%       0.000us       0.000us      17.734ms         2.08%      17.734ms     656.815us            27  
void at::native::vectorized_elementwise_kernel<4, at...         0.00%       0.000us         0.00%       0.000us       0.000us      17.039ms         2.00%      17.039ms      25.356us           672  
-------------------------------------------------------  ------------  ------------  ------------  ------------  ------------  ------------  ------------  ------------  ------------  ------------  
Self CPU time total: 7.061s
Self CUDA time total: 851.959ms

1360
1368
STAGE:2024-06-06 11:43:55 281092:281092 ActivityProfilerController.cpp:314] Completed Stage: Warm Up
1376
1384
1392
STAGE:2024-06-06 11:44:02 281092:281092 ActivityProfilerController.cpp:320] Completed Stage: Collection
STAGE:2024-06-06 11:44:02 281092:281092 ActivityProfilerController.cpp:324] Completed Stage: Post Processing
-------------------------------------------------------  ------------  ------------  ------------  ------------  ------------  ------------  ------------  ------------  ------------  ------------  
                                                   Name    Self CPU %      Self CPU   CPU total %     CPU total  CPU time avg     Self CUDA   Self CUDA %    CUDA total  CUDA time avg    # of Calls  
-------------------------------------------------------  ------------  ------------  ------------  ------------  ------------  ------------  ------------  ------------  ------------  ------------  
ncclDevKernel_Broadcast_RING_LL(ncclDevComm*, unsign...         0.00%       0.000us         0.00%       0.000us       0.000us     436.187ms        44.70%     436.187ms       1.039ms           420  
                                 ampere_sgemm_128x64_tn         0.00%       0.000us         0.00%       0.000us       0.000us     136.013ms        13.94%     136.013ms      73.600us          1848  
                                ampere_sgemm_128x128_nn         0.00%       0.000us         0.00%       0.000us       0.000us      71.492ms         7.33%      71.492ms      52.957us          1350  
                                 ampere_sgemm_32x128_tn         0.00%       0.000us         0.00%       0.000us       0.000us      44.146ms         4.52%      44.146ms      72.134us           612  
void at::native::(anonymous namespace)::RowwiseMomen...         0.00%       0.000us         0.00%       0.000us       0.000us      43.402ms         4.45%      43.402ms     102.605us           423  
void at::native::elementwise_kernel<128, 2, at::nati...         0.00%       0.000us         0.00%       0.000us       0.000us      33.839ms         3.47%      33.839ms       7.099us          4767  
void at::native::elementwise_kernel<128, 2, at::nati...         0.00%       0.000us         0.00%       0.000us       0.000us      25.563ms         2.62%      25.563ms      23.604us          1083  
void at::native::(anonymous namespace)::CatArrayBatc...         0.00%       0.000us         0.00%       0.000us       0.000us      23.609ms         2.42%      23.609ms     281.060us            84  
     cudnn_infer_ampere_scudnn_128x128_relu_small_nn_v1         0.00%       0.000us         0.00%       0.000us       0.000us      18.131ms         1.86%      18.131ms     671.519us            27  
void at::native::vectorized_elementwise_kernel<4, at...         0.00%       0.000us         0.00%       0.000us       0.000us      17.041ms         1.75%      17.041ms      25.359us           672  
-------------------------------------------------------  ------------  ------------  ------------  ------------  ------------  ------------  ------------  ------------  ------------  ------------  
Self CPU time total: 7.035s
Self CUDA time total: 975.911ms

I’m not sure yet how to interpret this, but I hope it’s helpful.

You could check this post to create a visual profile which should allow you to narrow down bottlenecks easier.