Since there’s a 1-second gap even between two batch norm kernels, the total execution time certainly shouldn’t be just a few milliseconds. Why is this happening? Am I misunderstanding the data captured by nsys? Or is there an issue with my measurement method? Or does this measurement method only count the sum of kernel execution times without including idle periods?
Additionally, could I use the time elapsed between CUDA profiling initialization and CUDA profiling data flush as my total time (including time for H to D or D to H data transfers)?
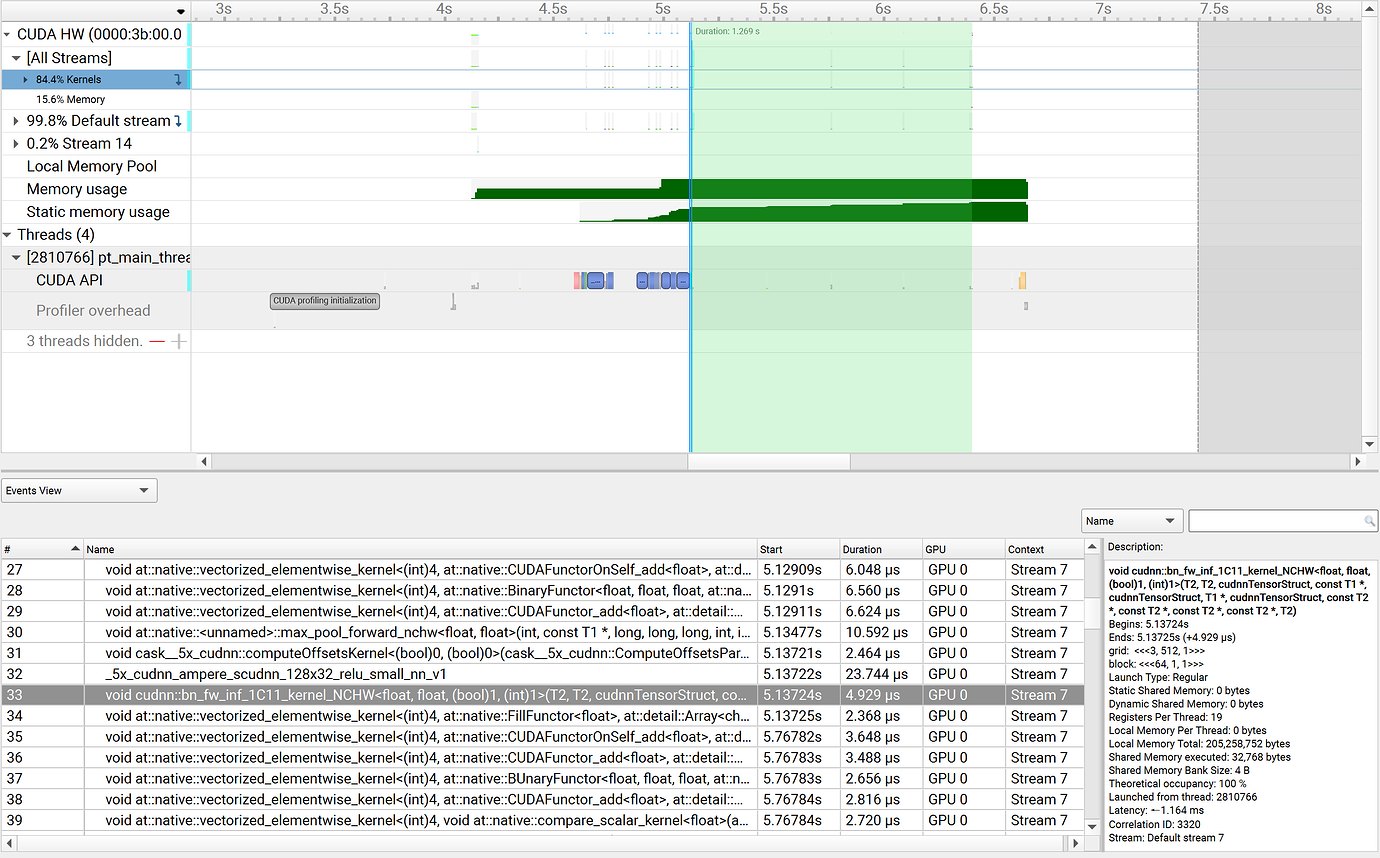
Your events measure the kernel execution time on the GPU, not host overhead, IDLE times, CPU bottlenecks etc. The Nsight System view shows you the actual timeline with kernel lauches, kernel execution time, etc.
Thank you very much for your response!! I think I understand what you mean.
I’d like to ask some more detailed questions:
If I want to get the actual execution time (including kernel launch and idle waiting times in between), can I get that directly through instrumentation in PyTorch?
Or can I get it directly from nsys, but I’m not sure which point in the nsys timeline I should use as the start of timing and which point as the end?
I would recommend sticking to a visual profiler to get a full overview of the execution timeline. Nsight systems or the native PyTorch profiler would be some options.
You can use nvtx markers inside your code to mark regions which would show up in nsys.
Why is the idle time between kernels so long? The kernel execution time is only a few milliseconds, but the waiting time is over a second, which is a completely different order of magnitude.
Is this normal behavior without applying other optimizations? What causes this situation?
Or is it because the model I’m executing or the input data is relatively small, resulting in this phenomenon?
Your workload might be CPU-limited meaning your CPU is not fast enough in scheduling the kernels. You could try to apply CUDA Graphs to reduce the CPU overhead and profile it again.