A.Normalize([0.485, 0.456, 0.406], [0.229, 0.224, 0.225])
ToTensorV2(p=1.0)
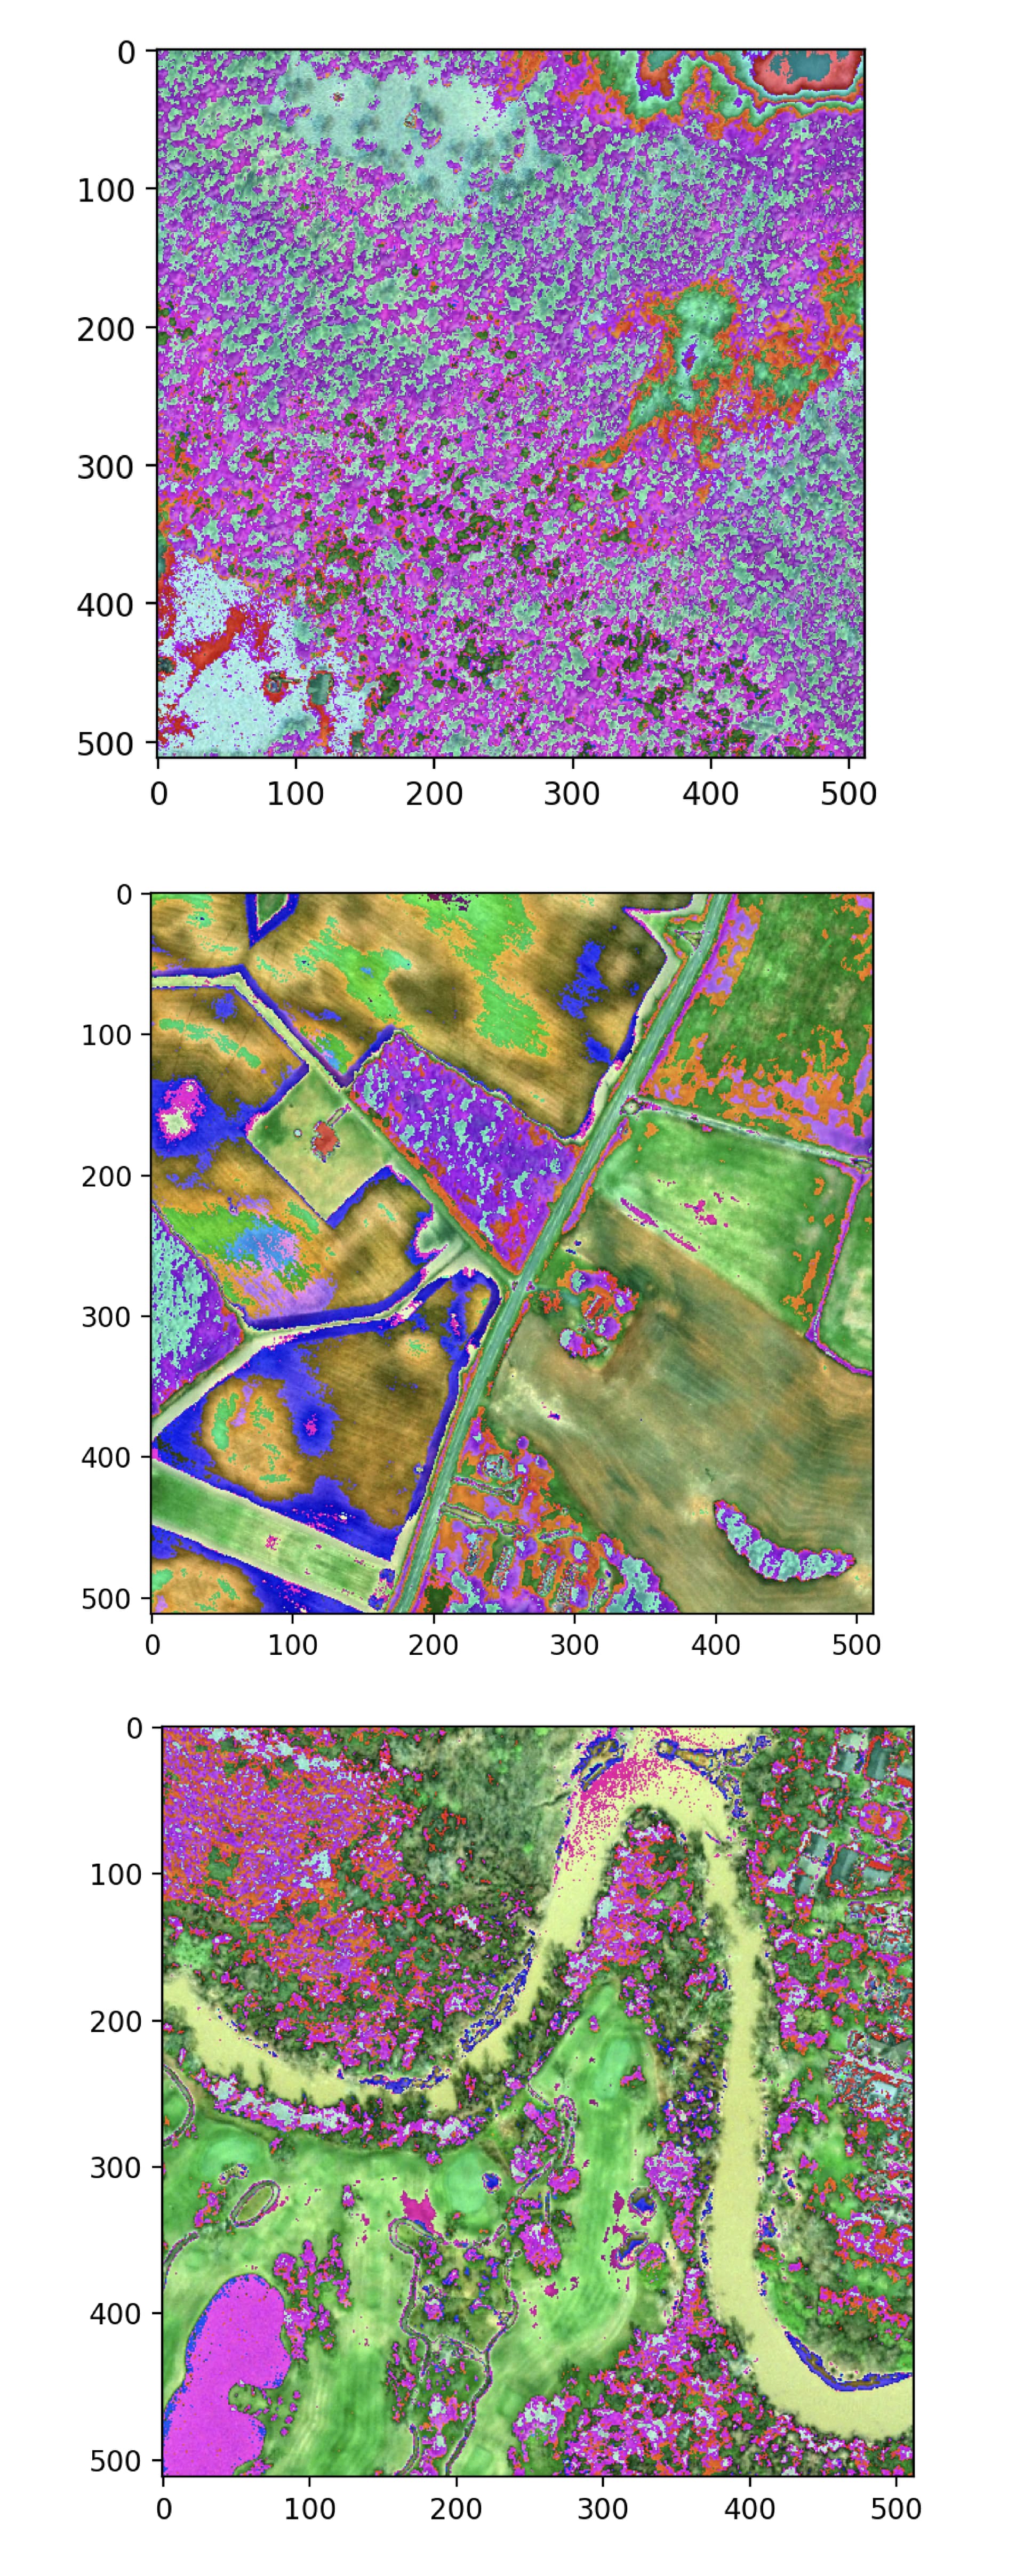
is this how the images look like after normalization
The normalization creates a zero-mean and unit variance output and is thus expected. matplotlib will also clip the values as is mentioned in the usual warning you would get:
Clipping input data to the valid range for imshow with RGB data ([0..1] for floats or [0..255] for integers).