I’ve recently been studying a very simple case where I index a CUDA tensor in GPU. As far as I know, the indexing operation is adapted for GPU execution with potential speedups regarding CPU.
In the small example below, I access elements in tensor a according to the mask tensor b. I have both the indexed tensor and the tensor of indices on GPU, and after running the script, I would expect no CPU involvement at all. I study the behavior of the code with a profiler:
import torch
import torch.autograd.profiler as profiler
a = torch.rand((10000)).to('cuda:0')
b = torch.ones_like(a).bool()
with profiler.profile() as prof:
with profiler.record_function("CHAIN_FORWARD"):
for i in range(10):
a[b]
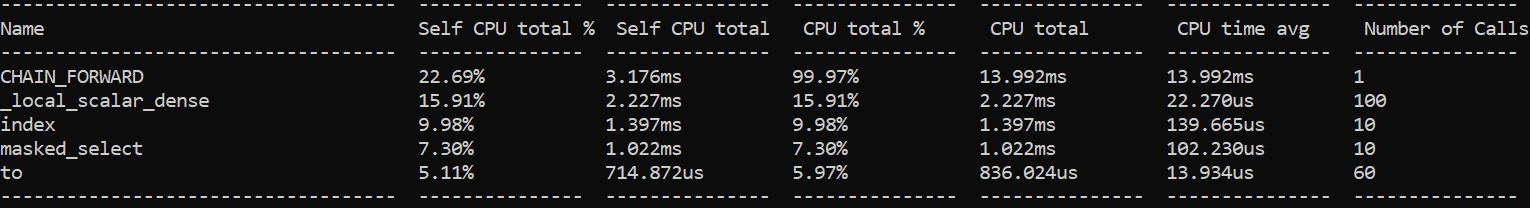
print(prof.key_averages().table(sort_by='self_cpu_time_total', row_limit=5))
As you can see, the operation to(), which transfers data to and from different devices, has been called 60 times. How comes? I am using PyTorch version 1.5.0
.to() doesn’t necessarily involve cross-device copying, and I wouldn’t expect it here. I’d guess it is either to(dtype=int) form or no-op protective calls (like x=x.to(y)). Chrome trace or nvtx profiling mode would tell you more about these calls.
I don’t think this would be directly recorded, this would imply messed up profiling report.
I agree with @googlebot what capturing the profiling information would be confusing and bad.
Note that your current code snippet uses a BoolTensor to index a, which will yield a variable sized output tensor (in your example you are using torch.ones_like, so all values would be returned).
This would call into nonzero, which needs to synchronize as seen here. Besides that, the origin of the to() op could be found in a profiler as already explained.
If you are using Nsight Systems, you could have a look at this post to see how to enable backtraces.
Hi, does this mean that indexing a CUDA PyTorch tensor with say a python list of indices on the CPU does not carry information back and forth from GPU to CPU?
A good indicator would be to check for synchronizations or profile the actual code. To do so you could use torch.cuda.set_sync_debug_mode(debug_mode) and the profiling steps mentioned before.