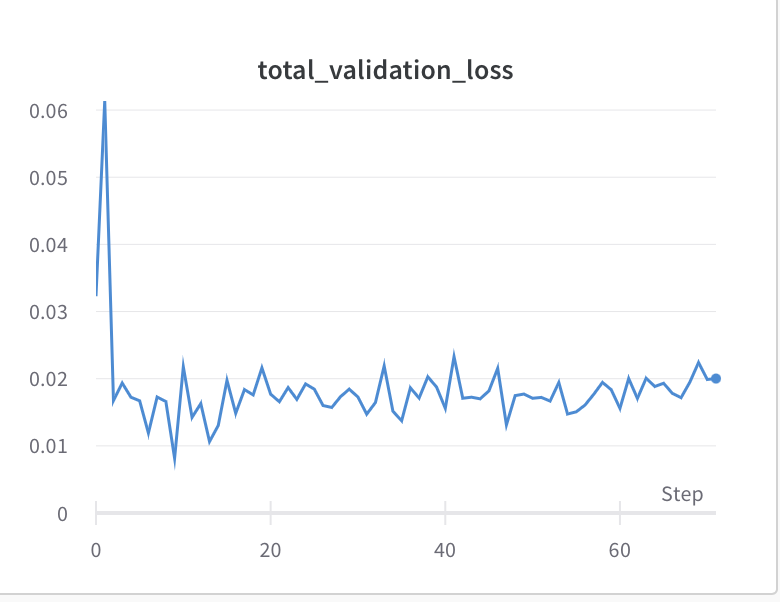
Hi, I’m having a haphazard looking training loss, but my validation loss is good. Please any idea on why this might be? below are both losses.

Could you describe how these losses are calculated?
E.g. if you are printing the mean training loss for each batch and the mean epoch validation loss, the different noise levels might be expected.
This is how I compute the losses, note that “compute_first_loss” and “compute_second_loss” are methods
  for epoch in tqdm(range(epochs)):
        for batch, data in enumerate(training_generator):

            X, Y = data[0].squeeze(-1).to(device).float(), data[1].squeeze(-1).to(device).float()

            output = model(X, Y)
            l1 = compute_first_loss(output[0][:-1])
            l2  = compute_second_loss(output[0][-1])
            loss = l1 + l2

            optimizer.zero_grad()
            loss.backward()
            optimizer.step()
            total_loss.append(loss.item())


            print(loss.item())


        #validation using current weights

        for val_batch, data in enumerate(validation_generator):

            X, Y = data[0].squeeze(-1).to(device).float(), data[1].squeeze(-1).to(device).float()
            with torch.no_grad():
                output = model(X, Y)
                l1_val = compute_first_loss(output[0][:-1])
                l2_val  = compute_second_loss(output[0][-1])
                loss_val = l1_val + l2_val

                total_val_loss.append(loss_val.item())
               print(loss_val.item())
Are these plots representing the calculated loss and loss_val from the code or how are you plotting these curves?
Yes loss and loss_val is what’s plotted. I’m using wandb to plot the curves. So the code is
wandb.log({"training_loss": loss.item(), "validation_loss": loss_val.item())}
This is plotted for every epoch. So for every epoch, I plot the last training and validation loss computed