I am debugging a memory usage issue for tensor-parallel training, and I observe that runs with tensor-parallelism enabled that OOM have large amounts of “reserved but not unallocated” memory (pointing to fragmentation). If I remove the all_reduce calls in the TP region (but change nothing else), the max batch size that can fit before OOM goes up significantly (up to 2x), and there is no sign of fragmentation.
Digging in, I have noticed the following odd behavior when you perform an all_reduce as part of model execution (as you do in tensor-parallel training). Consider this toy program that interleaves matmuls with all_reduce operations:
import os

import torch
import torch.nn.functional as F


class Model(torch.nn.Module):
    def __init__(self, dim, nlayers):
        super().__init__()
        self.layers = torch.nn.ModuleList()
        for _ in range(nlayers):
            self.layers.append(torch.nn.Linear(dim, dim, bias=False))

    def forward(self, x):
        for layer in self.layers:
            x = layer(x)
            torch.distributed.all_reduce(x)
        return x


def main():
    rank = int(os.environ["RANK"])
    assert rank >= 0
    torch.distributed.init_process_group(backend="nccl")
    torch.cuda.set_device(f"cuda:{rank}")

    dim = 8192
    nlayers = 8
    batch = 4096
    torch.cuda.memory._record_memory_history()

    model = Model(dim, nlayers)
    model.bfloat16()
    model.cuda()
    x = torch.randn((batch, dim), dtype=torch.bfloat16, device="cuda")

    with torch.no_grad():
        for _ in range(5):
            loss = model(x)

    torch.cuda.memory._dump_snapshot(f"snapshot-ar-{rank}.pkl")


if __name__ == "__main__":
    main()
I have run this on 2x GPUS with torchrun --standalone --nproc_per_node=2 memtest.py.
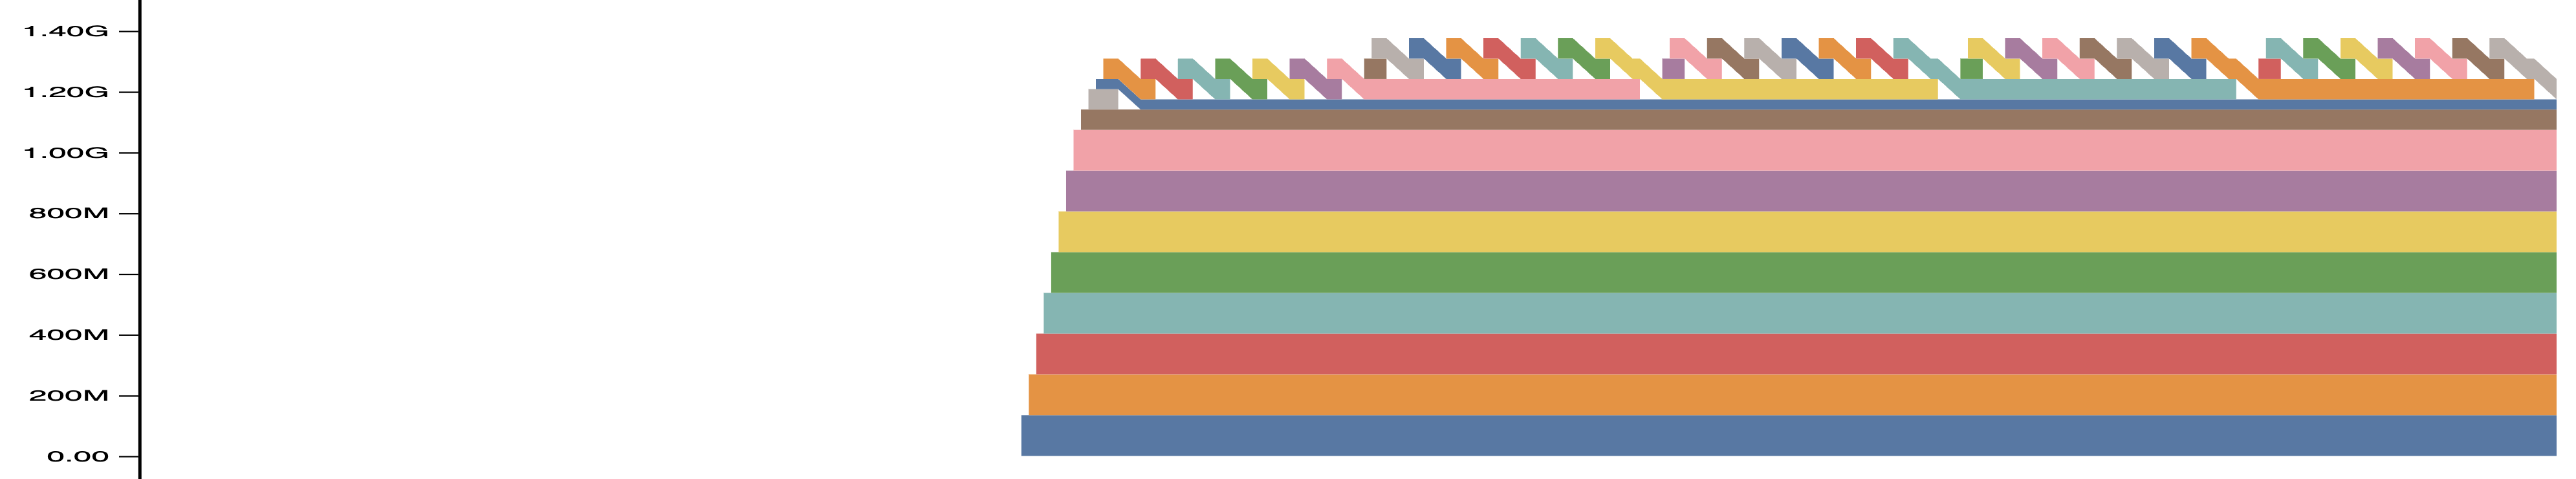
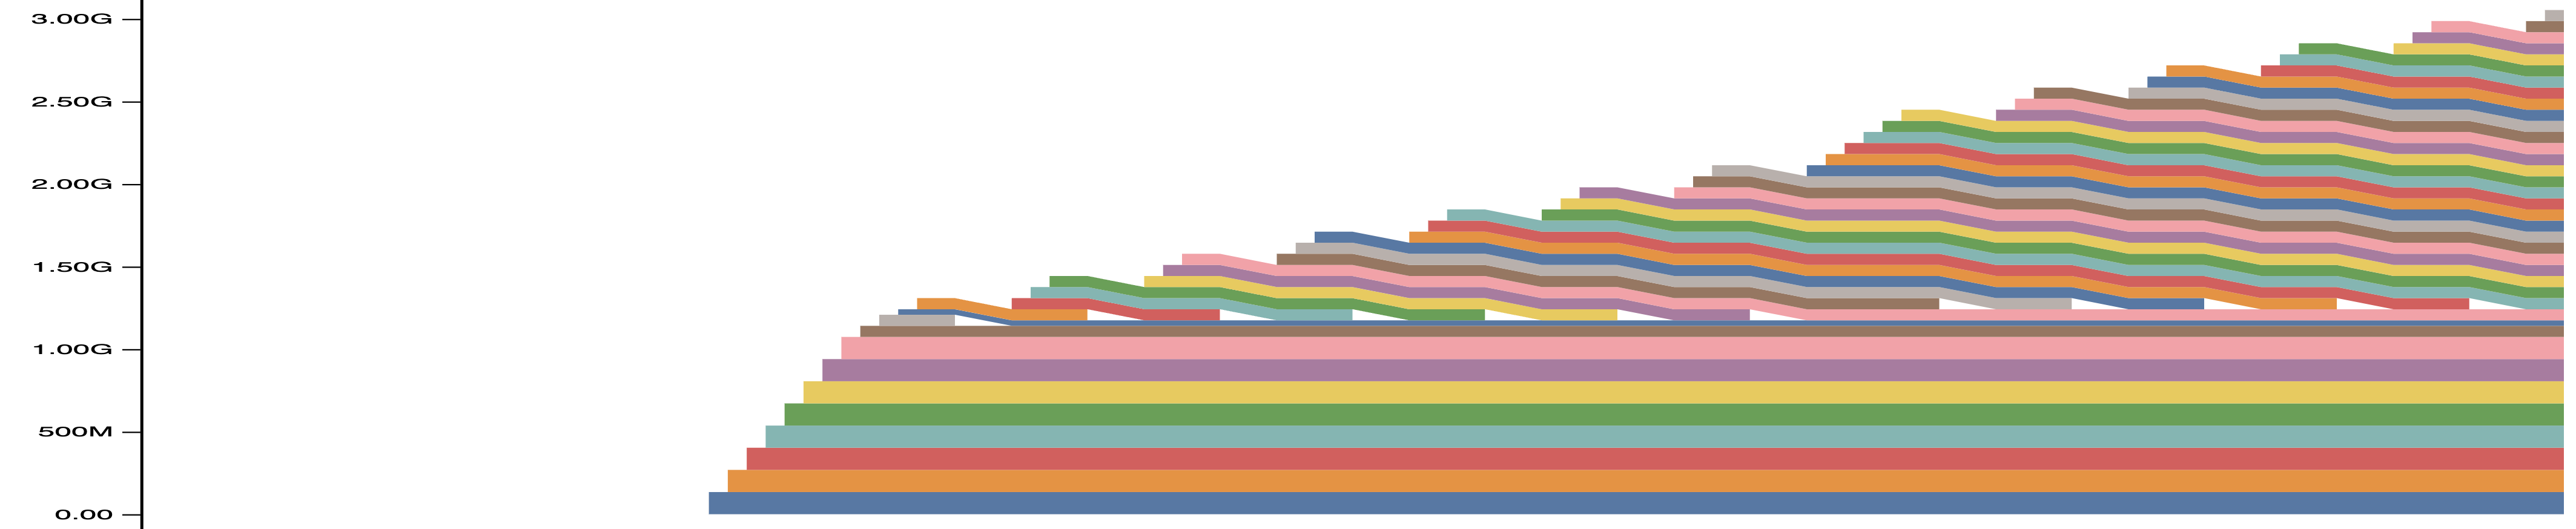
Here is what the memory visualizer shows in Active Memory for that code:
In contrast, if I remove the call to torch.distributed.all_reduce (but change nothing else), the visualizer shows:

The non-all_reduce picture makes sense: you can see each of the five iterations of the model, and within each iteration you can see the allocations per-layer for each matmul.
But the run with all_reduce enabled has long-lasting allocations that live both across layers and across loops of the model. Each of those long-lived allocations are the inputs to the all_reduce call. It makes sense that they should live a little longer (since all_reduce occurs in place), but that they persist across model iterations is perplexing.
My goal is to make the top picture look like the bottom one, so I’d love suggestions about what to try and / or any deeper insight into what the allocator is doing here. Thanks.