I’ve been trying to profile some of my code, and have noticed that it seemed awfully serial. So after a lot of deep dive, I came down to a single example I thought was relevant
import torch
import time

from torch.profiler import profile, record_function, ProfilerActivity

if __name__ == "__main__":

    N = 1000
    mul = 50
    num2 = 50

    profile_it = True

    streams = [torch.cuda.Stream() for _ in range(8)]

    for i in range(8):
        with torch.cuda.stream(streams[i]):
            torch.rand(10, 10, device='cuda:{}'.format(i))

    print(N)
    q2 = []
    qs = []
    for i in range(8):
        with torch.cuda.stream(streams[i]):
            temp = torch.rand(mul * N, mul * N, device='cuda:{}'.format(i))
            qs.append(temp)

    for i in range(8):
        temp = 'cuda:{}'.format(i)
        torch.cuda.synchronize(torch.device(temp))
        print(temp)


    if profile_it == True:
        with profile(activities=[ProfilerActivity.CUDA]) as prof2:
            for i, q in enumerate(qs):
                with torch.cuda.stream(streams[i]):
                        q2.append(q @ q @ q @ q)

    else:
        for i, q in enumerate(qs):
            with torch.cuda.stream(streams[i]):
                q2.append(q @ q @ q @ q)


    for i in range(8):
        temp = 'cuda:{}'.format(i)
        torch.cuda.synchronize(torch.device(temp))
        print(temp)

    if profile_it:
        prof2.export_chrome_trace('check.json')
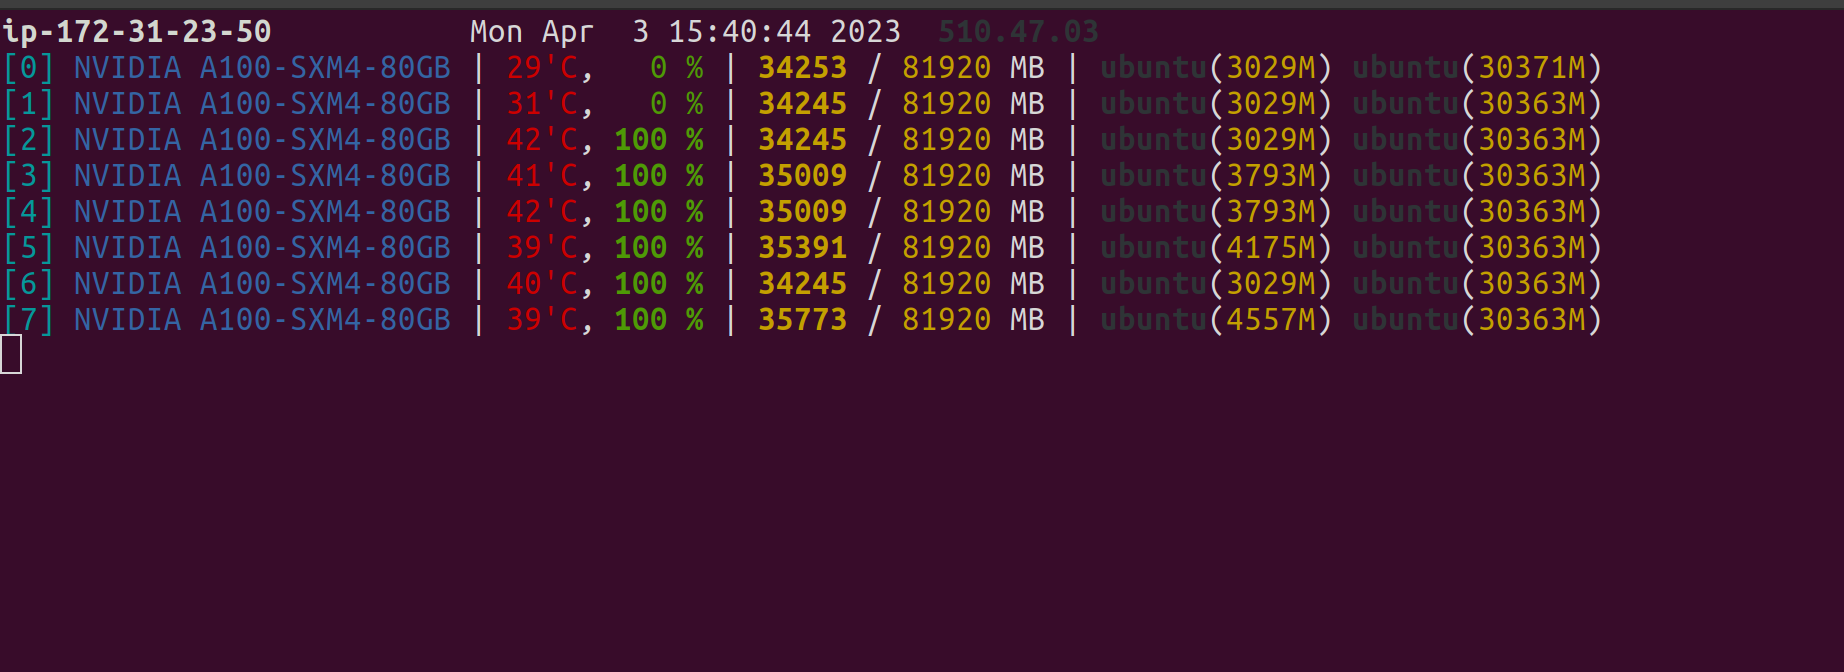
So when I keep the profiler off, this is what my gpu usage looks like:
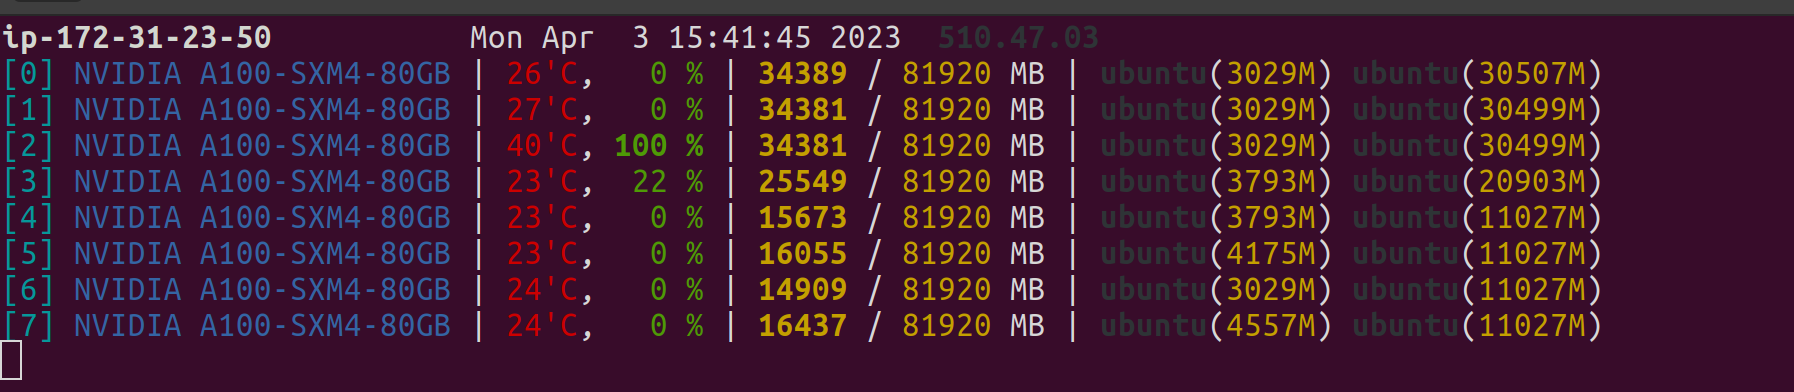
When I turn it on, here’s what it looks like:
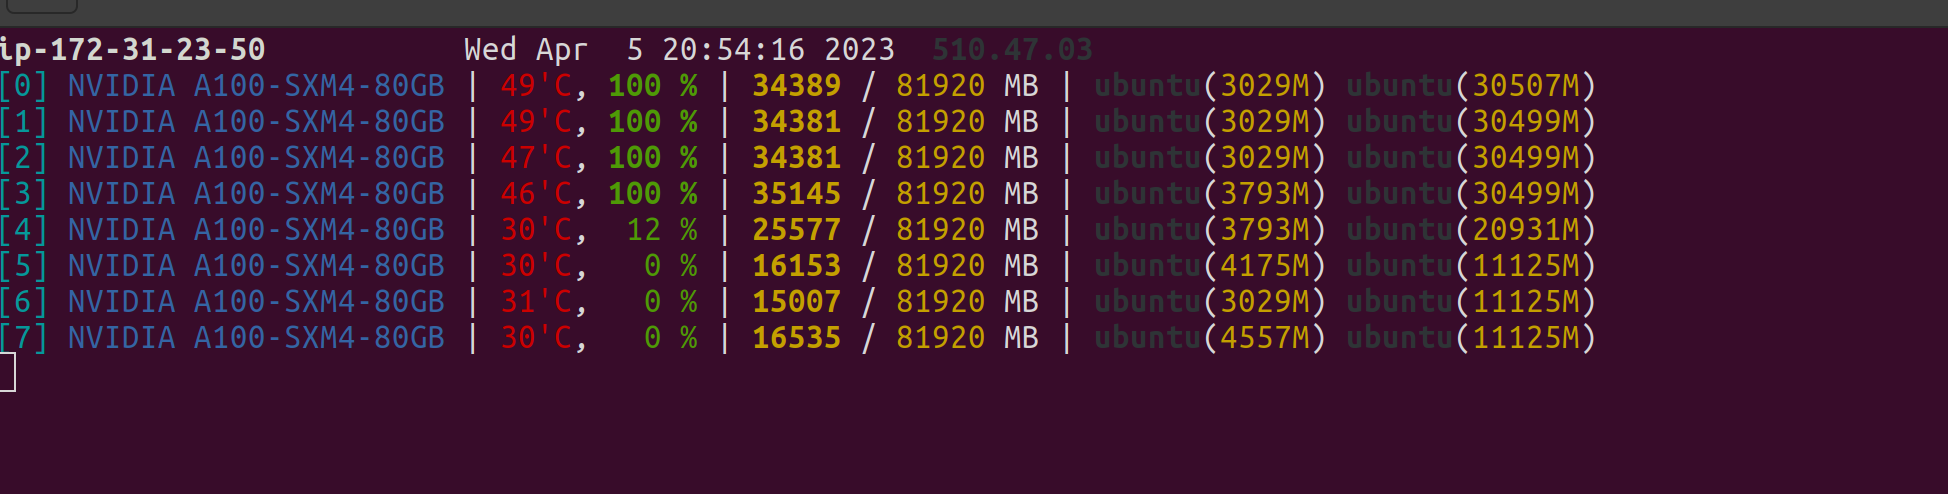
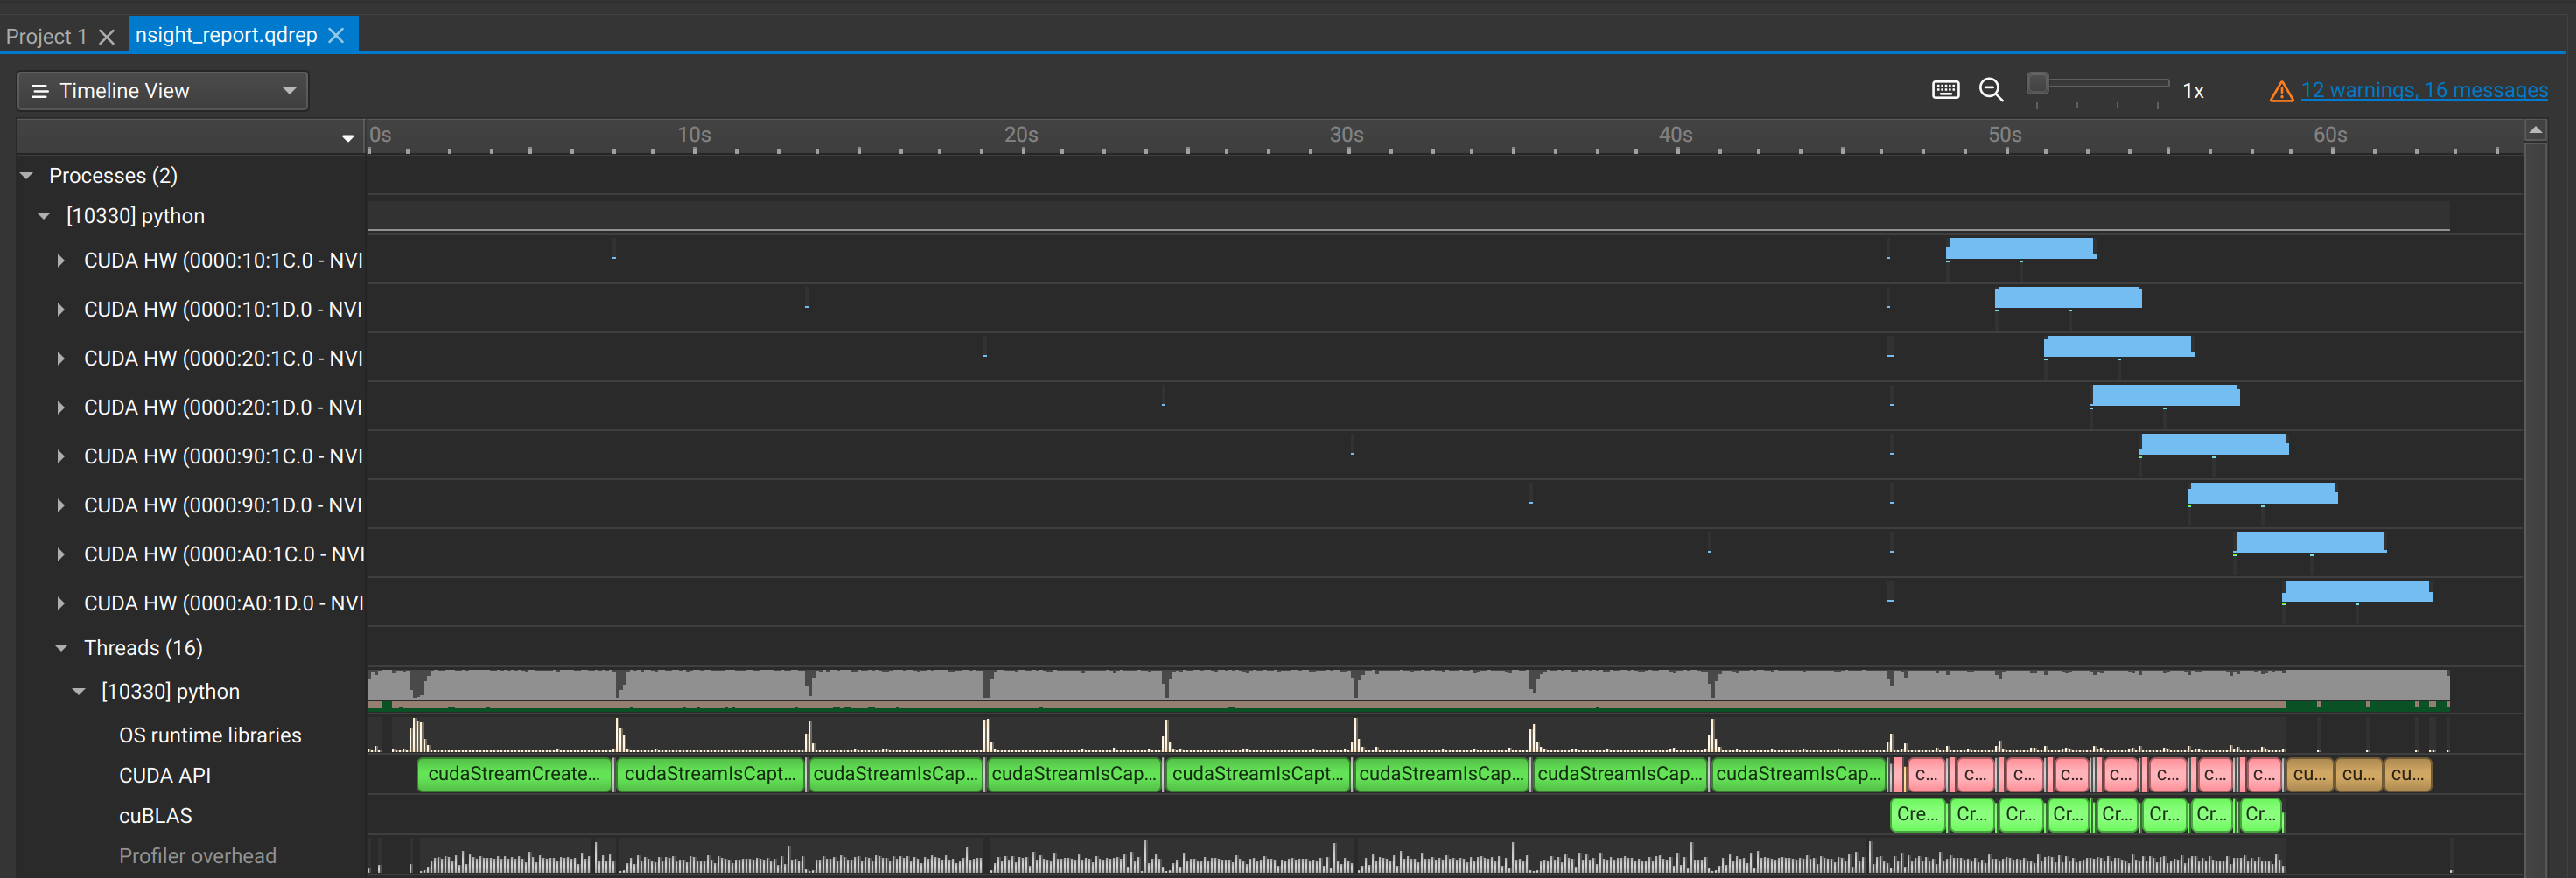
For the Nsight profiler using this, it looks like:
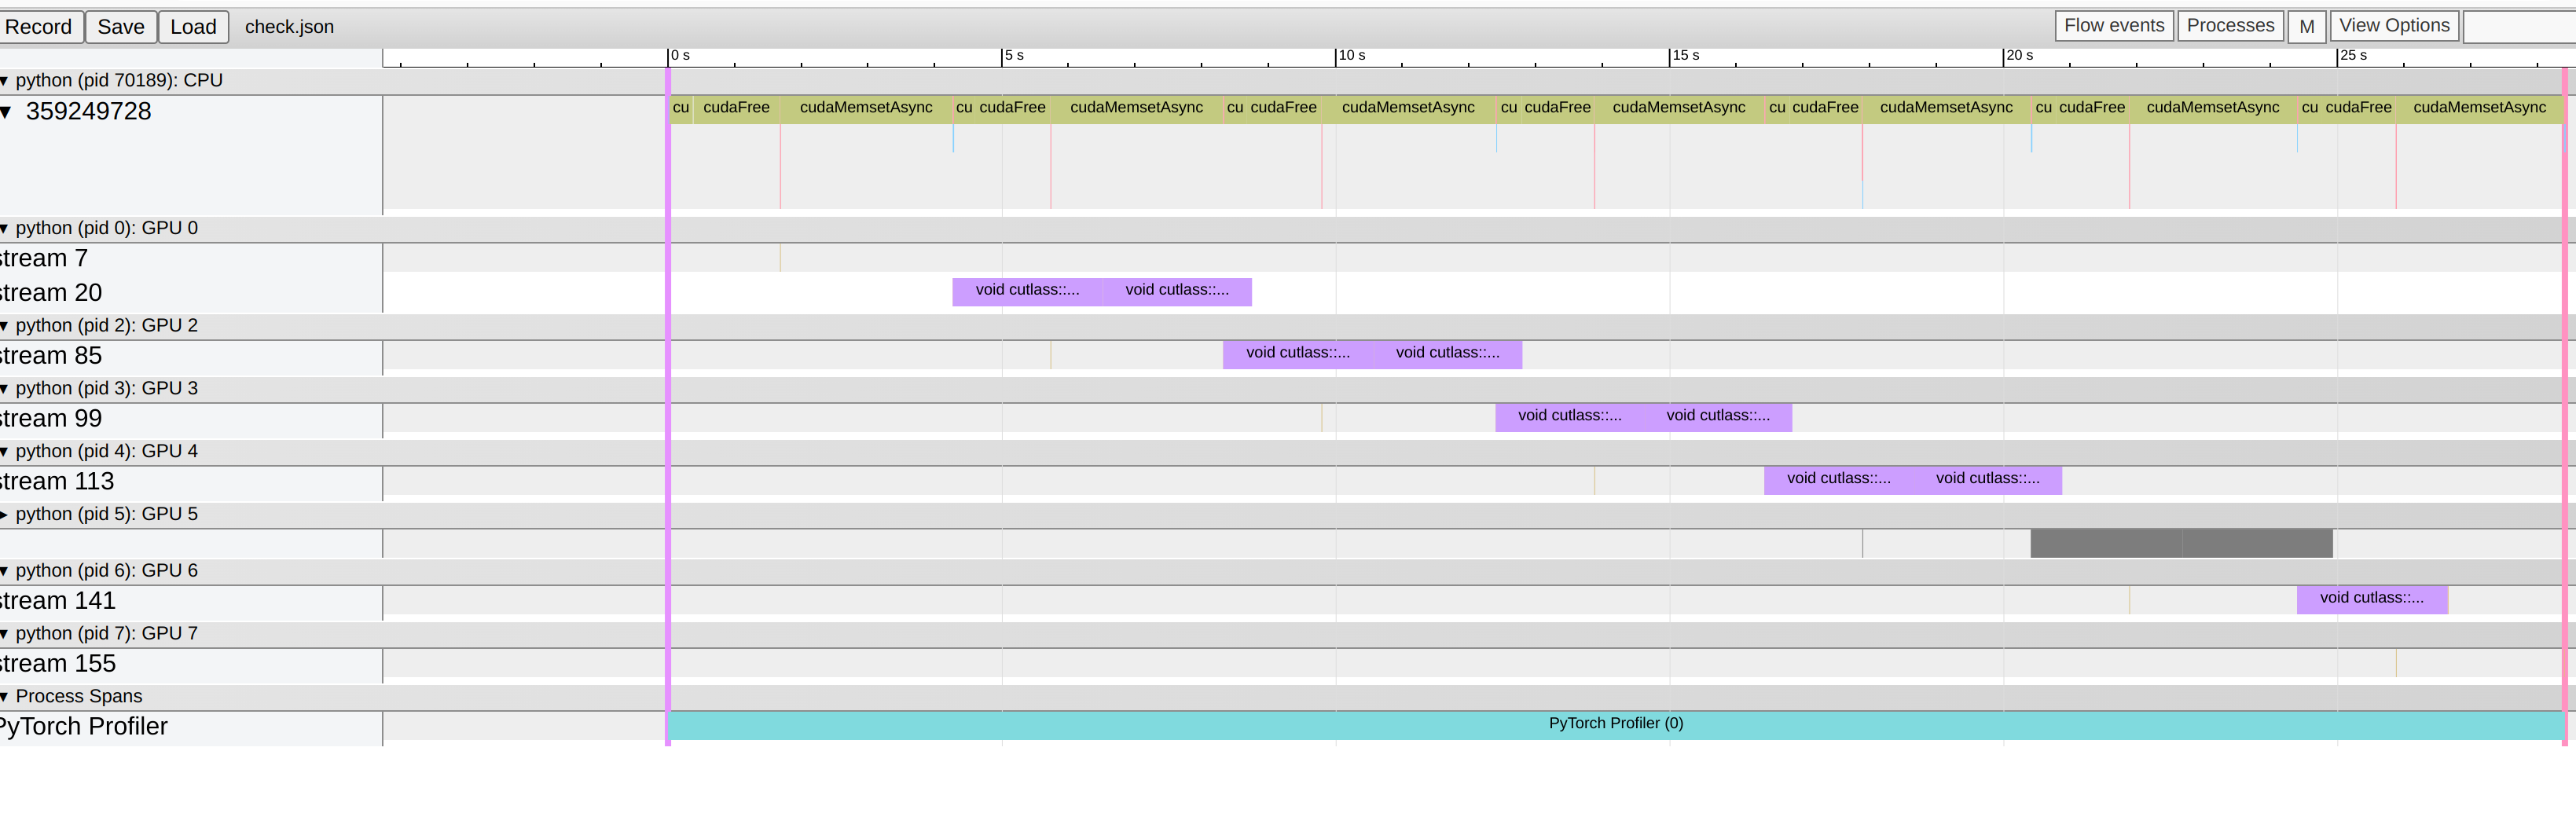
With a profile trace that looks right:
Is this expected behavior? I couldnt figure out from the doc strings if I should expect this -