I tried to reproduce the results by using the code provided in the tutorial on Single Machine Model Parallel Best Practices, however the results were a bit different.
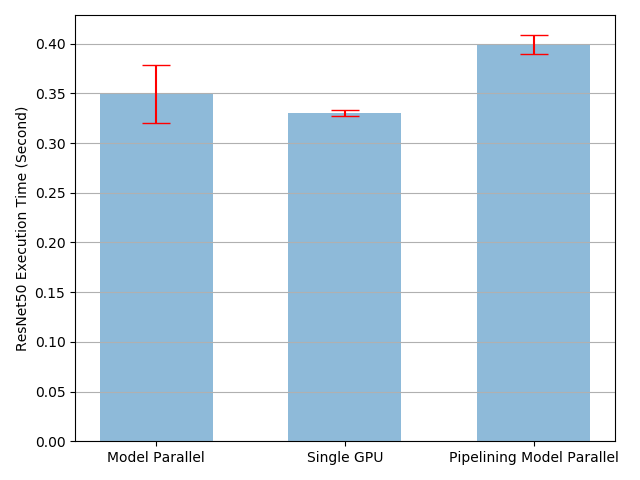
The model with pipelining is expected to perform better than than the rest two cases but it doesn’t. What can be the possible reasons for this?
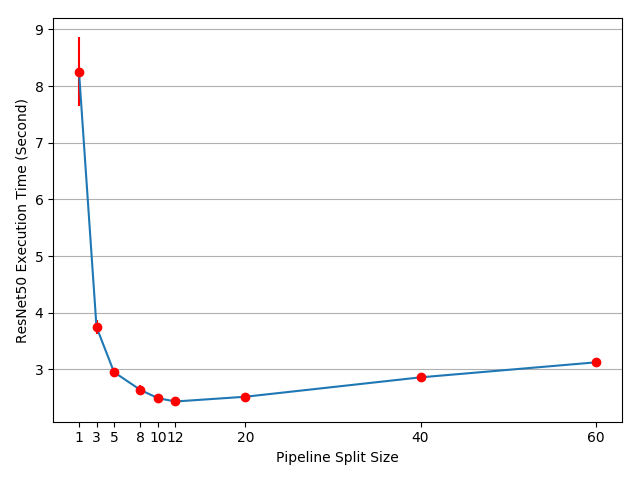
Hey @aniruddhadave, a lot of configurations could affect the performance, e.g., split size, hardware type, GPU interconnection bandwidth, model complexity, etc. And it does takes effort to get the best performance. One place to start with could be drawing the split size curve using your environment. I mean this figure blow. How does it look on your side?
I also observed a similar result.
This is the thread I created in the discussion.
I also benchmarked this using multiple configurations.
I am not sure about the concurrent run of the code. So I changed it as follows and got a sort of fine result.
class PipelineParallelResNet50(ModelParallelResNet50):
    def __init__(self, split_size=20, *args, **kwargs):
        super(PipelineParallelResNet50, self).__init__(*args, **kwargs)
        self.split_size = split_size

    def taskA(self, s_prev, ret):
        s_prev = self.seq2(s_prev)
        ret.append(self.fc(s_prev.view(s_prev.size(0), -1)))

    def taskB(self, s_next):
        s_prev = self.seq1(s_next).to('cuda:1')
        return s_prev

    def forward(self, x):
        splits = iter(x.split(self.split_size, dim=0))
        s_next = next(splits)
        s_prev = self.seq1(s_next).to('cuda:1')
        ret = []

        for s_next in splits:
            # A. s_prev runs on cuda:1
            # self.taskA(s_prev=s_prev, ret=ret)
            with concurrent.futures.ThreadPoolExecutor() as executor:
                futureA = executor.submit(self.taskA, s_prev, ret)
                futureA.result()

            # B. s_next runs on cuda:0, which can run concurrently with A
            with concurrent.futures.ThreadPoolExecutor() as executor:
                futureB = executor.submit(self.taskB, s_next)
                s_prev = futureB.result()

        s_prev = self.seq2(s_prev)
        ret.append(self.fc(s_prev.view(s_prev.size(0), -1)))

        return torch.cat(ret)
Based on the numbers you posted in that thread, looks like you get the best performance with split_size=60, which gives you around 1.8s execution time, and it is a little faster than the 2.2 single node time?
BTW are you using the same model as the tutorial?
Hey, Thank you for the response. The split size was indeed the reason for the difference inperformance. On changing the split size I was able to reduce the time for pipelined model.
I am exactly using the same code. I couldn’t replicate similar results.
Correct me if I have misunderstood the concept of running two micro-batches concurrently,
 for s_next in splits:
            # A. s_prev runs on cuda:1
            s_prev = self.seq2(s_prev)
            ret.append(self.fc(s_prev.view(s_prev.size(0), -1)))

            # B. s_next runs on cuda:0, which can run concurrently with A
            s_prev = self.seq1(s_next).to('cuda:1')
Here part A, and part B as shown in the comments must run concurrently to get the pipeline performance. Am I correct/wrong?
If so, as Pytorch eagerly executes the layers, it is not asynchronous? Am I following this right?
If both these clauses are true, having threads is required? Isn’t it?
My reasoning comes with the usage of the for loop. Here within the loop a concurrent execution could
happen if we use threads. Am I following this wrong?
No. Because CUDA operations run asynchronously from CPU’s point of view, unless you explicitly call synchronize() on CPU. And they are inserted into the same CUDA stream on each device in this example, which will guarantee ops on the same device run in order, but ops on different device can run in parallel.
Yes, it launches the CUDA kernel right away, but the CUDA kernel execution can be asynchronous. And CUDA will actually queue the kernels in the stream and to coordinate the execution. So, “launch right away” does not mean it will wait for the kernel to finish, nor does it mean the the kernel will start on GPU immediately.
No, with multiple CUDA device + async CUDA kernel behavior, you could still get parallel execution without threads. And actually, even with thread, all Python code on CPU will still run in sequentially due to GIL.
Yes, there is a part that GIL avoids. I was trying to use multiprocessing (torch version), it gave some memory issues. I understand your point.
I was trying to run this on K80 GPUs. I didn’t get the graph as shown in the tutorial. Does old hardware could be an issue for not getting the expected graph?
Could you share the script run command, I assumed it is just python scripy.py
do I have to use any specific flags or CUDA env variables that need to be set.
I am just curious why the performance is not there as expected in the tutorial.
Could you share the script run command, I assumed it is just python scripy.py
do I have to use any specific flags or CUDA env variables that need to be set.
I was actually using the exactly same script as shown in that tutorial. It is a .rst instead of a notebook because I don’t know what the hardware spec of our tutorial servers will be. I would like to avoid tuning parameters every time the underlying server hardware changes. I probably should have highlighted in the very beginning saying that the result will be different in different envs, and each env would require efforts to explore configuration space to get the best perf. ![]()
I did that a while back, and my server env should be either this:
+-----------------------------------------------------------------------------+
| NVIDIA-SMI 396.69                 Driver Version: 396.69                    |
|-------------------------------+----------------------+----------------------+
| GPU  Name        Persistence-M| Bus-Id        Disp.A | Volatile Uncorr. ECC |
| Fan  Temp  Perf  Pwr:Usage/Cap|         Memory-Usage | GPU-Util  Compute M. |
|===============================+======================+======================|
|   0  Tesla M40           On   | 00000000:0B:00.0 Off |                    0 |
|  0%   27C    P8    18W / 250W |      0MiB / 11448MiB |      0%      Default |
+-------------------------------+----------------------+----------------------+
|   1  Tesla M40           On   | 00000000:0D:00.0 Off |                    0 |
|  0%   25C    P8    18W / 250W |      0MiB / 11448MiB |      0%      Default |
+-------------------------------+----------------------+----------------------+

+-----------------------------------------------------------------------------+
| Processes:                                                       GPU Memory |
|  GPU       PID   Type   Process name                             Usage      |
|=============================================================================|
|  No running processes found                                                 |
+-----------------------------------------------------------------------------+
        GPU0    GPU1    CPU Affinity
GPU0     X      PIX     0-11,24-35
GPU1    PIX      X      0-11,24-35
or this:
+-----------------------------------------------------------------------------+
| NVIDIA-SMI 418.116.00   Driver Version: 418.116.00   CUDA Version: 10.1     |
|-------------------------------+----------------------+----------------------+
| GPU  Name        Persistence-M| Bus-Id        Disp.A | Volatile Uncorr. ECC |
| Fan  Temp  Perf  Pwr:Usage/Cap|         Memory-Usage | GPU-Util  Compute M. |
|===============================+======================+======================|
|   0  Quadro GP100        On   | 00000000:81:00.0 Off |                    0 |
| 26%   32C    P0    29W / 235W |      1MiB / 16278MiB |      0%      Default |
+-------------------------------+----------------------+----------------------+
|   1  Quadro GP100        On   | 00000000:82:00.0 Off |                    0 |
| 26%   33C    P0    30W / 235W |      1MiB / 16278MiB |      0%      Default |
+-------------------------------+----------------------+----------------------+

+-----------------------------------------------------------------------------+
| Processes:                                                       GPU Memory |
|  GPU       PID   Type   Process name                             Usage      |
|=============================================================================|
|  No running processes found                                                 |
+-----------------------------------------------------------------------------+
	GPU0	GPU1	CPU Affinity
GPU0	 X 	NV4	12-23
GPU1	NV4	 X 	12-23
Thanks a lot for finding the machine configs. I will see if I can run in modern hardware.
For K80s that was the best I was able to produce. I did some micro-benchmarks as well to understand some of the bottlenecks. But for my experiments I got the optimum results close to end of the curve (end of the curve meaning the graphs +infinity direction).
But I didn’t get a significant speed up from the code. That’s why I was trying different approaches.