alx
January 25, 2020, 4:41am
1
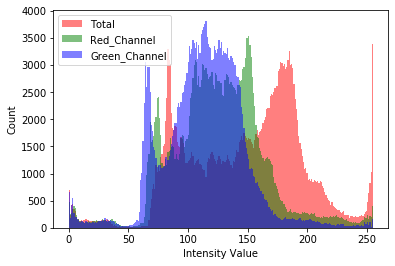
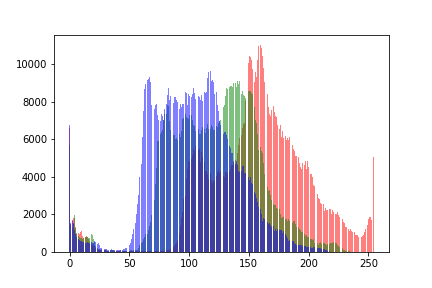
Hi, I was able to plot a histogram for a single image as such:
from skimage import io
import matplotlib.pyplot as plt
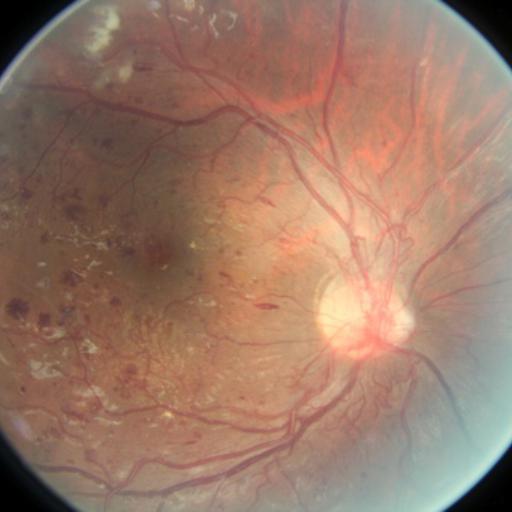
image = io.imread('./1084_left.jpeg')
#_ = plt.hist(image.ravel(), bins = 256, color = 'orange', )
_ = plt.hist(image[:, :, 0].ravel(), bins = 256, color = 'red', alpha = 0.5)
_ = plt.hist(image[:, :, 1].ravel(), bins = 256, color = 'Green', alpha = 0.5)
_ = plt.hist(image[:, :, 2].ravel(), bins = 256, color = 'Blue', alpha = 0.5)
_ = plt.xlabel('Intensity Value')
_ = plt.ylabel('Count')
_ = plt.legend(['Total', 'Red_Channel', 'Green_Channel', 'Blue_Channel'])
plt.show()
Now, I would know like to see the color distribution of my whole datatset: one plot for all the images.
Does anyone know how to do this?
I assume you cannot load all images into your RAM, so you could instead calculate the bin count for each image and sum it together:
nb_bins = 256
count_r = np.zeros(nb_bins)
count_g = np.zeros(nb_bins)
count_b = np.zeros(nb_bins)
for image in range(10):
    x = np.random.randint(0, 256, (3, 244, 244))
    hist_r = np.histogram(x[0], bins=nb_bins, range=[0, 255])
    hist_g = np.histogram(x[1], bins=nb_bins, range=[0, 255])
    hist_b = np.histogram(x[2], bins=nb_bins, range=[0, 255])
    count_r += hist_r[0]
    count_g += hist_g[0]
    count_b += hist_b[0]

bins = hist_r[1]
fig = plt.figure()
plt.bar(bins[:-1], count_r, color='r', alpha=0.33)
plt.bar(bins[:-1], count_g, color='g', alpha=0.33)
plt.bar(bins[:-1], count_b, color='b', alpha=0.33)
You might a better answer in a matplotlib or numpy specific discussion board, but the method should work.
alx
January 25, 2020, 9:41pm
3
Cool solution! it works but the plot is very different. I’ll check out a matplotlib forum, good idea!
Do you get this plot using my example code snippet?
Yeah, hearing from some matplotlib experts would be good and please share the solution here.
alx
January 25, 2020, 9:45pm
5
Hey, yes, here’s what I used:
import numpy as np
from skimage import io
import matplotlib.pyplot as plt


nb_bins = 256
count_r = np.zeros(nb_bins)
count_g = np.zeros(nb_bins)
count_b = np.zeros(nb_bins)

root = './'
for image in os.listdir(root):
  if image.endswith('.jpeg'):
    x = io.imread(root+image)
    hist_r = np.histogram(x[0], bins=nb_bins, range=[0, 255])
    hist_g = np.histogram(x[1], bins=nb_bins, range=[0, 255])
    hist_b = np.histogram(x[2], bins=nb_bins, range=[0, 255])
    count_r += hist_r[0]
    count_g += hist_g[0]
    count_b += hist_b[0]

bins = hist_r[1]
fig = plt.figure()
plt.bar(bins[:-1], count_r, color='r', alpha=0.33)
plt.bar(bins[:-1], count_g, color='g', alpha=0.33)
plt.bar(bins[:-1], count_b, color='b', alpha=0.33)
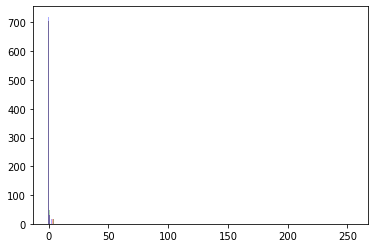
It seems the loaded image contains a lot of black pixels. Are you loading the same image as in your initial post?
alx
January 25, 2020, 9:49pm
7
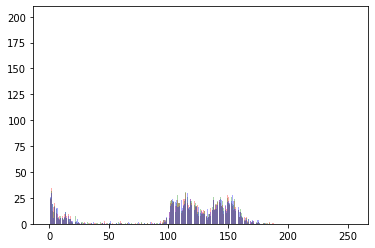
No! I was comparing two different ones. Here’s for the same image:
Would it be possible to upload this image here?
ptrblck
January 25, 2020, 10:07pm
10
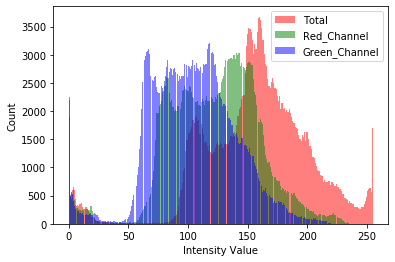
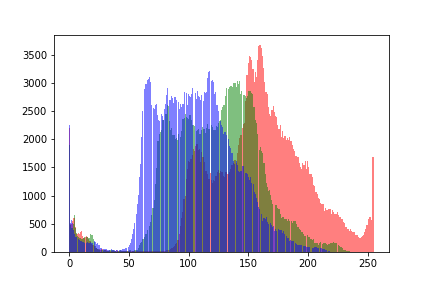
I get quite the same results for this image using the “manual” approach and plt.hist:
Manual:
plt.hist:
alx
January 25, 2020, 10:13pm
11
So you used my code for plot one and your code for plot two? That’s odd.
Can you paste the code you used to plot your method by passing an image (and not rand)
Also! if you notice, the y axis values are quite different
ptrblck
January 25, 2020, 10:20pm
12
Ah, I had an error in the code summing into count_x instead of resetting, as I used my code for multiple images. I get the same counts now for both approaches using this code:
nb_bins = 256
count_r = np.zeros(nb_bins)
count_g = np.zeros(nb_bins)
count_b = np.zeros(nb_bins)

img = Image.open('./discuss_eye_test.jpeg')

# Calculate manual hist
x = np.array(img)
x = x.transpose(2, 0, 1)
hist_r = np.histogram(x[0], bins=nb_bins, range=[0, 255])
hist_g = np.histogram(x[1], bins=nb_bins, range=[0, 255])
hist_b = np.histogram(x[2], bins=nb_bins, range=[0, 255])
count_r = hist_r[0]
count_g = hist_g[0]
count_b = hist_b[0]

# Plot manual
bins = hist_r[1]
fig = plt.figure()
plt.bar(bins[:-1], count_r, color='r', alpha=0.5)
plt.bar(bins[:-1], count_g, color='g', alpha=0.5)
plt.bar(bins[:-1], count_b, color='b', alpha=0.5)

# Plot matplotlib
fig2 = plt.figure()
plt.hist(x[0].ravel(), bins = 256, color = 'red', alpha = 0.5)
plt.hist(x[1].ravel(), bins = 256, color = 'green', alpha = 0.5)
plt.hist(x[2].ravel(), bins = 256, color = 'blue', alpha = 0.5)
alx
January 25, 2020, 10:27pm
13
Cool! I have the same result as well.
How can you now compute multiple images? Do you need something like:
for image in os.listdir('test_images'):
  img = Image.open(image)
  x = np.array(img)
That only seems to plot the histo of the last image.
ptrblck
January 25, 2020, 10:34pm
14
My initial code snippet should accumulate the counts of all images into the count_x arrays, so that you could plot the histogram of all images.
alx
January 25, 2020, 10:37pm
15
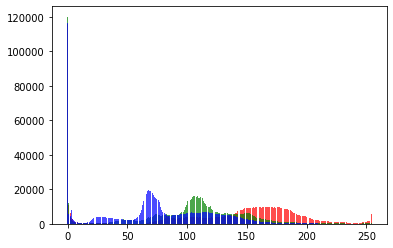
Got it, I changed it just a bit:
nb_bins = 256
count_r = np.zeros(nb_bins)
count_g = np.zeros(nb_bins)
count_b = np.zeros(nb_bins)

for image in os.listdir('./test/'):
  img = Image.open('./test/'+image)
  x = np.array(img)
  x = x.transpose(2, 0, 1)
  hist_r = np.histogram(x[0], bins=nb_bins, range=[0, 255])
  hist_g = np.histogram(x[1], bins=nb_bins, range=[0, 255])
  hist_b = np.histogram(x[2], bins=nb_bins, range=[0, 255])
  count_r += hist_r[0]
  count_g += hist_g[0]
  count_b += hist_b[0]

bins = hist_r[1]
fig = plt.figure()
plt.bar(bins[:-1], count_r, color='r', alpha=0.7)
plt.bar(bins[:-1], count_g, color='g', alpha=0.7)
plt.bar(bins[:-1], count_b, color='b', alpha=0.7)
Any idea why the plotted curves break like that?
1 Like
saba
July 17, 2020, 7:32am
16
Hi
        hist_r = np.histogram(kk.squeeze(0).view(-1).detach().numpy(),bins=100)
        fig = plt.figure()
        bins = hist_r[1]
        count_r=hist_r[0]
        plt.bar(bins[:-1], count_r, color='b', alpha=0.33)
Is my example code working for you or is the figure also empty?
saba
July 18, 2020, 6:17am
18
I redo it again it work. Would you please tell me how I can define the bins in the sequence of the numbers ? like that bins=[0:0.1:1] or [0:10:255]
You can pass the bin edges to the bins argument directly in np.histogram.
bins int or sequence of scalars or str, optionalbins is an int, it defines the number of equal-width bins in the given range (10, by default). If bins is a sequence, it defines a monotonically increasing array of bin edges, including the rightmost edge, allowing for non-uniform bin widths.bins is a string, it defines the method used to calculate the optimal bin width, as defined by histogram_bin_edges .
saba
October 2, 2020, 8:01am
20
Hi Ptrblck,
Would you please help me with that which function I can use to give me the density function, the smooth version of the histogram? I used the current function but it gives me individual bins, I need a smoothed version.