I noticed that 99% of the GPU RAM is still being used after and no process is listed by nvidia-smi after PyTorch aborts with an
RuntimeError: cuda runtime error (2) : out of memory at /opt/conda/conda-bld/pytorch_1518244421288/work/torch/lib/THC/generic/THCStorage.see you:58
One could run sudo nvidia-smi --gpu-reset -i 0 as a remedy, however, it would be nice if PyTorch could free the memory after such a “crash” – not sure if this is only a problem in my particular case, so I wanted to ask if others have the same issue (before I post a GitHub issue)
EDIT 1: I should mention that the memory is freed if I e.g., interrupt or kill a process, it’s just the RuntimeError: cuda runtime error (2) : out of memory which doesn’t seem to free the memory
EDIT 2: It does not seem to be just a reporting issue by nvidia-smi as I can’t run even smaller networks on that card after I encountered that issue
I am currently using PyTorch 0.3.1 with Cuda 9.0 via Miniconda. The graphics cards where this happens are Tesla K80’s (tried multiple different ones), and I have had the same issue with Tesla K20’s.
I honestly don’t think it’s cause of the GPU. I’ve tried it on a GTX 970m and a Titan XP and it works fine.
The only other difference from your setup is that I installed using pip on a virtual environment.
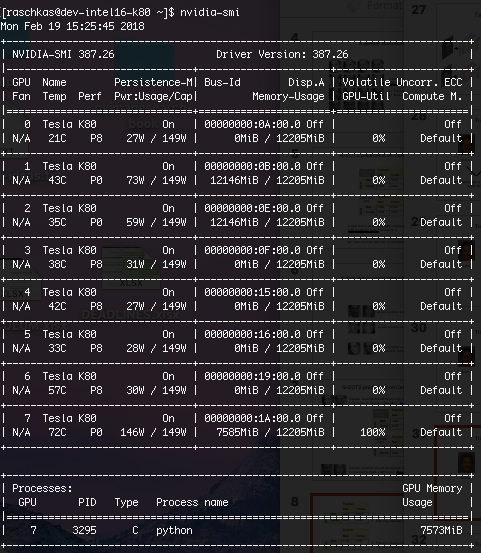
Hm, that’s interesting! There are 8 Tesla K80’s in that rack, and I just checked, the two ones where I “crashed” the PyTorch code (via RuntimeError: cuda runtime error (2) : out of memory) still occupy that memory (GPU 1 & 2, GPU 7 is the one I am currently using)
Are you using multithreading (particularly a multi-threaded dataloader)? Sometimes not all the child processes die with the main process and you need to check top or ps and kill them yourself.
That’s a good point, I am indeed using a multi-threaded data loader! Hm, I can’t see any child processes hanging around though.
EDIT: I just checked again, the displayed memory use of the cards 1 & 2 is indeed not just a nvidia-smi display issue, I can’t run anything on these cards until I clear out the memory manually
I have the same issue using a multi-threaded dataloader on a GTX 1060, sometimes it frees the memory after cuda runtime error (2) : out of memory) and sometimes it doesn’t which is a bit strange.
Just to make sure that I understand correctly. You are saying that nvidia-smi shows the memory as held even if the Python process running PyTorch is terminated by the cuda OOM error, right?
Yes that’s correct. And it’s not only nvidia-smi showing this (e.g., because of some caching issue) but the card really holds that memory (I can’t run any code on these cards anymore if they are not reset)
I’ve seen similar things happen if the processes holding memory is
something like a python subprocess. Could you check if your running
processes don’t contain something that look suspicious?
@rabst
so, I remember this issue. When investigating, we found that there’s actually a bug in python multiprocessing that might keep the child process hanging around, as zombie processes.
It is not even visible to nvidia-smi.
The solution is killall python, or to ps -elf | grep python and find them and kill -9 [pid] to them.
I actually killed all main process via ps, but I forgot to call ps -aux which showed the child processes hanging around. Killing these helped freeing the memory. Thanks!
Solved my problem, thanks! Do you know if that’s a known bug listed on the Python bugtracker? Otherwise it might be worth adding it. Or maybe as a warning to users, it might be useful to modify the Runtime error message to warn users about that if possible?
Thank you so much for sharing the information. I actually came across this bug today when I terminated a PyTorch program which used a multi-threaded data loader. After killing the program, I tried to rerun it again but kept seeing CUDA OOM error. Running nvidia-smi showed everything was fine. And cudaMemGetInfo also did not expose the problem. For more details, please refer to this reply.
Now I think I understand why it “worked” that way.
When doing multi-gpu training with DistributedDataParallel, the zombie processes will not show up in nvidia-smi. But I found the following command helpful for killing zombie processes,
I have the same proble.
first, I open a python shell, type import torch
this time I open another ssh type watch nvidia-smi
second I return to first python shell, create a tensor(27,3,480,270) and move it to cuda input = torch.rand(27,3,480,270).cuda()
the page of nvidia-smi change, and cuda memory increase
third, use ctrl+Z to quit python shell.
The cuda memory is not auto-free. The nvidia-smi page indicate the memory is still using.
The solution is you can use kill -9 <pid> to kill and free the cuda memory by hand.
I use Ubuntu 1604, python 3.5, pytorch 1.0.
Although the problem solved, it`s uncomfortable that the cuda memory can not automatically free