I’m trying to profile a model’s memory usage right now using this tutorial: Understanding GPU Memory 1: Visualizing All Allocations over Time | PyTorch. Looking at the output, almost all of the memory usage is listed as Unknown (screenshot attached). When I step through the code watching nvidia-smi, it looks like the biggest increase in memory comes during the forward pass of the model. Does anyone have suggestions on how to debug this further? I can post my code, but my model/dataset are spread over several files. Aside from the model/dataset import, I exactly follow the code in Appendix B of the link above. Is there a more methodical way to find out which parts of my model are leading to the largest costs in memory?
Similarly, here’s the screenshot showing memory by tensor. But as I don’t see an obvious way to associate that to specific tensors in the model, I’m not sure how to use this to debug further (I’m using four random batches with different sequence lengths).
Check if there are certain allocations that are continuous across the iterations. These are probably hogging memory without being part of the training cycle
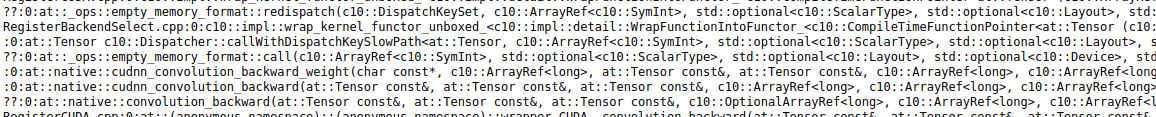
If the stack shows *_backward they are part of backward propagation
Yeah, the “Unknown” memory category can make profiling frustrating. One thing that might help is breaking down the forward pass into smaller chunks and using torch.cuda.memory_allocated() or torch.cuda.memory_snapshot() at different points to narrow down where the spikes are happening. Also, wrapping parts of your forward method with torch.autograd.profiler.profile(use_cuda=True) might give you better granularity. If your model is spread over multiple files, maybe try isolating smaller parts and running them with dummy inputs to see how much memory each one uses. That might help tie the large tensors back to specific layers or ops.