Visualize feature map

Hi, all.
I have some questions about the visualization.
I`m newbie in this field…so maybe this is silly questions.

I have MNIST dataset. and I want to visualize the output of my encoder.
(Input: MNIST data) -> MY_ENCODER -> output -> visualization.

  1. How can I visualize the data from output of CNN ?

  2. If I use MNIST dataset as input to my encoder, can I use the output of this encoder to re-construct
    image like original MNIST ?
    If this is impossible, do I have to use re-construction loss with decoder ?

  3. Is there any support codes to visualize feature map ?

9 Likes
  1. You can just use a plot library like matplotlib to visualize the output.

  2. Sure! You could use some loss function like nn.BCELoss as your criterion to reconstruct the images.

  3. Forward hooks are a good choice to get the activation map for a certain input.

Here is a small code example as a starter:

import torch
import torch.nn as nn
import torch.optim as optim
import torch.nn.functional as F
from torch.utils.data import DataLoader

import torchvision.transforms as transforms
import torchvision.datasets as datasets

import matplotlib.pyplot as plt


class MyModel(nn.Module):
    def __init__(self):
        super(MyModel, self).__init__()
        self.conv1 = nn.Conv2d(1, 3, 3, 1, 1)
        self.pool1 = nn.MaxPool2d(2)
        self.conv2 = nn.Conv2d(3, 6, 3, 1, 1)
        self.pool2 = nn.MaxPool2d(2)
        
        self.conv_trans1 = nn.ConvTranspose2d(6, 3, 4, 2, 1)
        self.conv_trans2 = nn.ConvTranspose2d(3, 1, 4, 2, 1)
        
    def forward(self, x):
        x = F.relu(self.pool1(self.conv1(x)))
        x = F.relu(self.pool2(self.conv2(x)))        
        x = F.relu(self.conv_trans1(x))
        x = self.conv_trans2(x)
        return x

dataset = datasets.MNIST(
    root='PATH',
    transform=transforms.ToTensor()
)
loader = DataLoader(
    dataset,
    num_workers=2,
    batch_size=8,
    shuffle=True
)

model = MyModel()
criterion = nn.BCEWithLogitsLoss()
optimizer = optim.Adam(model.parameters(), lr=1e-3)

epochs = 1
for epoch in range(epochs):
    for batch_idx, (data, target) in enumerate(loader):
        optimizer.zero_grad()
        output = model(data)
        loss = criterion(output, data)
        loss.backward()
        optimizer.step()
        
        print('Epoch {}, Batch idx {}, loss {}'.format(
            epoch, batch_idx, loss.item()))


def normalize_output(img):
    img = img - img.min()
    img = img / img.max()
    return img

# Plot some images
idx = torch.randint(0, output.size(0), ())
pred = normalize_output(output[idx, 0])
img = data[idx, 0]

fig, axarr = plt.subplots(1, 2)
axarr[0].imshow(img.detach().numpy())
axarr[1].imshow(pred.detach().numpy())

# Visualize feature maps
activation = {}
def get_activation(name):
    def hook(model, input, output):
        activation[name] = output.detach()
    return hook

model.conv1.register_forward_hook(get_activation('conv1'))
data, _ = dataset[0]
data.unsqueeze_(0)
output = model(data)

act = activation['conv1'].squeeze()
fig, axarr = plt.subplots(act.size(0))
for idx in range(act.size(0)):
    axarr[idx].imshow(act[idx])
44 Likes

Thanks for help newbie…!

I have some questions again…(sorry to bother you)

  1. In your code, MyModel() looks like just kinds of model.
    but I can’t distinguish between classifier model or reconstruction model.
    How can this model do works for re-construct ?

  2. I have encoder model and I want to visualize what the results of this encoder generate reconstruction images, then what should I add components to reconstruct images?

  3. get_activation() function in your code, this output is looks like digit. I think this is output of first conv but how can first conv generate like digit.
    fig2
    I expected image like those feature maps.
    I’m confused about feature map…T.T
    feature

  1. The model I created is reconstructing the images just by its architecture. As you can see I’ve created a “bottleneck” in the model, i.e. the activations will get smaller, and after it I used transposed conv layers to increase the spatial size again.
    The last layer outputs the same shape as the input had. While this simple model is working on the MNIST dataset, it might be too simple for other more complicated models.

  2. You could need to add the decoding part, i.e. creating output images out of your latent vector. Depending on your encoder’s output, you might need to reshape it. If you need some help implementing it, could you post your encoder architecture?

  3. Yes, you are currently visualizing the activations, i.e. the output of intermediate layers. In case you want to visualize the kernels directly, you could use the following code:

# Visualize conv filter
kernels = model.conv1.weight.detach()
fig, axarr = plt.subplots(kernels.size(0))
for idx in range(kernels.size(0)):
    axarr[idx].imshow(kernels[idx].squeeze())
5 Likes

@ptrblck
Here is my encoder model. I need your help to get reconstruct image.
and I have generated filter image with your code then how can I generate feature map from this filter figure?

class Extractor(nn.Module):
    def __init__(self):
        super(Extractor, self).__init__()
        self.extractor = nn.Sequential(
            nn.Conv2d(in_channels=3, out_channels=64, kernel_size=5, stride=1, padding=2),
            nn.ReLU(True),
            nn.MaxPool2d(kernel_size=2),

            nn.Conv2d(in_channels=64, out_channels=128, kernel_size=5, stride=1, padding=0),
            nn.ReLU(True),
            nn.MaxPool2d(kernel_size=2),

            nn.Conv2d(in_channels=128, out_channels=256, kernel_size=5, stride=1, padding=0),
            nn.ReLU(True),
            nn.MaxPool2d(kernel_size=2),
        )

    def forward(self, x):
        x = self.extractor(x)
        x = x.view(-1, out_size)
        return x

fig_filter

Based on your architecture, a decoder could look like this:

class Extractor(nn.Module):
    def __init__(self):
        super(Extractor, self).__init__()
        self.extractor = nn.Sequential(
            nn.Conv2d(in_channels=3, out_channels=64, kernel_size=5, stride=1, padding=2),
            nn.ReLU(True),
            nn.MaxPool2d(kernel_size=2),

            nn.Conv2d(in_channels=64, out_channels=128, kernel_size=5, stride=1, padding=0),
            nn.ReLU(True),
            nn.MaxPool2d(kernel_size=2),

            nn.Conv2d(in_channels=128, out_channels=256, kernel_size=5, stride=1, padding=0),
            nn.ReLU(True),
            nn.MaxPool2d(kernel_size=2),
        )
        
        self.decoder = nn.Sequential(
            nn.ConvTranspose2d(256, 128, 5, 2),
            nn.ReLU(),
            nn.ConvTranspose2d(128, 64, 6, 2),
            nn.ReLU(),
            nn.ConvTranspose2d(64, 3, 6, 2)
        )

    def forward(self, x):
        x = self.extractor(x)
        x = self.decoder(x)
        return x

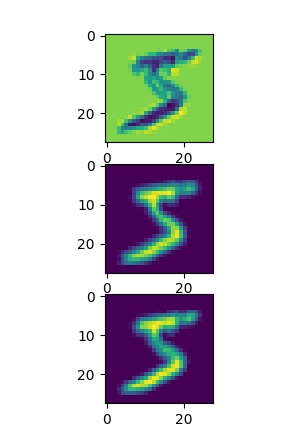
To visualize the activations, you could try the same code as above:

model = Extractor()
model.extractor[0].register_forward_hook(get_activation('ext_conv1'))
x = torch.randn(1, 3, 96, 96)
output = model(x)
print(output.shape)
> torch.Size([1, 3, 96, 96])

act = activation['ext_conv1'].squeeze()
num_plot = 4
fig, axarr = plt.subplots(min(act.size(0), num_plot))
for idx in range(min(act.size(0), num_plot)):
    axarr[idx].imshow(act[idx])

I’m just plotting the first 4 maps, so you could just remove num_plot and the min call if you want to plot all maps.

3 Likes

@ptrblck
cool !

Now I can get filter image.(3x3 in you examples)
How can I apply this filter to input image?
To get feature map like this .
feature

1 Like

The image you’ve posted is from a Krizhevsky et al. and shows the learned filter kernels.
You are not seeing a feature map, but 96 kernels of size 3x11x11.
To get a similar image, you can use this code snippet:

from torchvision.utils import make_grid

kernels = model.extractor[0].weight.detach().clone()
kernels = kernels - kernels.min()
kernels = kernels / kernels.max()
img = make_grid(kernels)
plt.imshow(img.permute(1, 2, 0))
10 Likes

How can get feature map not kernels ?

Would this approach work?

3 Likes

In the line:
img = data[idx, 0]
array “data” is referenced, although it is not defined before! - code is working ok, but how?..

data and output are both defined in the training for loop.
I’m just reusing them for visualization.

1 Like

@ptrblck how we can display output of layer in the original size of image. for example in UNet layer up2 (decoder section) the torch feature output size is torch.Size([1, 128, 120, 160]) how can I display it on the original size of image which is [1, 240, 320]?

Actually, I posted same question in separate thread https://discuss.pytorch.org/t/how-visualise-feature-map-in-original-size-of-input/39778

This is some super helpful code for me! One question I have is whether the activation captured by the hook is pre or post the application of the ReLU function? Thanks!

It would be pre-ReLU based on the registered hook.
However, since self.extractor uses inplace nn.ReLUs after the conv layers, the relu will be applied on the stored activation.

Hey @ptrblck:

What are there images in the link? https://towardsdatascience.com/how-to-visualize-convolutional-features-in-40-lines-of-code-70b7d87b0030

Are they activation maps or kernels?

Feature map visualization: https://youtu.be/RNnKtNrsrmg
Some images from the video:

1 Like

Hi @ptrblck,

I’m learning PyTorch. I tried your code for the activation but I got an error.

TypeError                                 Traceback (most recent call last)
<ipython-input-71-94fc5c43ff92> in <module>()
     12 axarr[0].imshow(img.detach().numpy())
     13 # print(pred.detach().numpy().shape)
---> 14 axarr[1].imshow(pred.detach().numpy())
     15 # Visualize feature maps
     16 activation = {}

4 frames
/usr/local/lib/python3.6/dist-packages/matplotlib/image.py in set_data(self, A)
    688                 or self._A.ndim == 3 and self._A.shape[-1] in [3, 4]):
    689             raise TypeError("Invalid shape {} for image data"
--> 690                             .format(self._A.shape))
    691 
    692         if self._A.ndim == 3:

TypeError: Invalid shape () for image data

I’m working on cifar 10 dataset and shape of my training data
X_train_torch is (50000, 3, 32, 32)

Thanks!

Could you post the shape of pred?
If it’s more than a single prediction, you should index it first, since imshow can only visualize a single array.

Why the shape of pred is empty?

print(pred.shape)
>>>torch.Size([])