Is your model predicting image-like outputs?
It seems preds might be just a scalar tensor.
Yes. Here is my code.
class Net(nn.Module):
    def __init__(self):
        super(Net, self).__init__()
        self.conv1 = nn.Conv2d(3, 6, 7, 1, 3)
        self.pool = nn.MaxPool2d(2, 2)
        self.conv2 = nn.Conv2d(6, 16, 7, 1, 3)
        self.fc1 = nn.Linear(16 * 8 * 8, 128)
        self.fc2 = nn.Linear(128, 64)
        self.fc3 = nn.Linear(64, 32)
        self.fc4 = nn.Linear(32, 10)

    def forward(self, x):
        x = self.pool(F.relu(self.conv1(x)))
        x = self.pool(F.relu(self.conv2(x)))
        x = x.view(-1, 16 * 8 * 8)
        x = F.relu(self.fc1(x))
        x = F.relu(self.fc2(x))
        x = F.relu(self.fc3(x))
        x = self.fc4(x)
        return x


net = Net()

#training loop
for epoch in range(1,num_epoch+1):
    for i in range(0,len(X_train),batch_size):
        X = X_train_torch[i:i+batch_size]
        y = y_train_torch[i:i+batch_size]
        optimizer.zero_grad()
        y_pred = net(X)
        l = loss(y_pred,y)


        l.backward()
        optimizer.step()
    print("Epoch %d final minibatch had loss %.4f" % (epoch, l.item()))

#testing loop
class_correct = list(0. for i in range(10))
class_total = list(0. for i in range(10))
with torch.no_grad():
    for i in range(0,len(X_test),batch_size):
        xt = X_test_torch[i:i+batch_size]
        yt = y_test_torch[i:i+batch_size]
        outputs = net(xt)
        _, predicted = torch.max(outputs.data, 1)
        c = (predicted == yt).squeeze()
        for i in range(4):
            label = yt[i]
            class_correct[label] += c[i].item()
            class_total[label] += 1


for i in range(10):
    print('Accuracy of %5s : %2d %%' % (
        classes[i], 100 * class_correct[i] / class_total[i]))

# normalizing the output
def normalize_output(img):
    img = img - img.min()
    img = img / img.max()
    return img

# Plot some images
idx = torch.randint(0, outputs.size(0), ())
pred = normalize_output(outputs[idx, 0])
img = X_train_torch[idx, 0]
print(pred.shape)
fig, axarr = plt.subplots(1, 2)
axarr[0].imshow(img.detach().numpy())
axarr[1].imshow(pred.detach().numpy())
# Visualize feature maps
activation = {}
def get_activation(name):
    def hook(model, input, output):
        activation[name] = output.detach()
    return hook

net.conv1.register_forward_hook(get_activation('conv1'))
data = X_train_torch[0]
data.unsqueeze_(0)
output = net(data)

act = activation['conv1'].squeeze()

# fig, axarr = plt.subplots(act.size(0))
j = 0
for i in range(2):
  f,(ax1,ax2,ax3,ax4) = plt.subplots(1,4,sharex=True)
  ax1.imshow(act[j])
  ax2.imshow(act[j+1])
  ax3.imshow(act[j+2])
  ax4.imshow(act[j+3])

  j = j+4
In that case imshow won’t work, as it visualizes images.
What is your use case and what would you like to visualize or plot?
Got it. I’m trying to plot the activations.
sorry to bother you, I wonder how you solved this problem
print(pred.shape)
torch.Size()
@ptrblck Yes, are there any solutions for this error. My img works but my pred variable returns empty and causes the invalid shape error. I am using the ImageNet dataset and it does output images.
If your model outputs a scalar tensor, you won’t be able to plot it as an image using plt.imshow.
How would you like to plot this scalar value?
CC @max_jiang
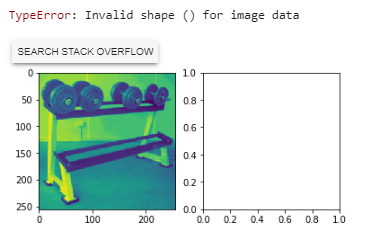
The img variable is plotted on the left, I would like the pred variable to be also plotted in the same way in its respective box. Is this possible?
That should be possible, if your model outputs e.g. a segmentation map (logits corresponding to each class for all pixels).
However, since the shape of the output seems to be empty, it seems your model currently outputs a scalar.
Which model are you currently using?
This is my model here:
class ConvNet(nn.Module):
def __init__(self, num_classes=10):
    super(ConvNet, self).__init__()

        # Layer 1
    self.conv1 = nn.Conv2d(3, 16, 3)
    self.pool = nn.MaxPool2d(2, 2)

        # Layer 2
    self.conv2 = nn.Sequential(
        nn.Conv2d(16, 24, 4),
        nn.MaxPool2d(2, 2),
        nn.ReLU(),
        nn.Dropout(0.3)
    )

        # Layer 3
    self.conv3 = nn.Sequential(
        nn.Conv2d(24, 32, 4),
        nn.MaxPool2d(2, 2),
        nn.ReLU(),
        nn.Dropout(0.3)

    )

        # Fully Connected Layer 1
    self.fc1 = nn.Sequential(
        nn.Linear(32 * 29 * 29, 512)
    )

    self.fc2 = nn.Sequential(
        nn.Linear(512, num_classes),
    )

def forward(self, x):

  x = self.pool(torch.nn.functional.relu(self.conv1(x)))
  x = torch.nn.functional.dropout(x, p= 0.3)

  #x = self.conv1(x)
  x = self.conv2(x)
  x = self.conv3(x)

  x = x.reshape(x.size(0), -1)
  x = self.fc1(x)
  x = self.fc2(x)

  return x
Your model seems to be a classification model, which should yield an output of [batch_size, nb_classes]. This also means that you won’t get a prediction for each pixel in your input image.
I’m currently not sure, how you would like to visualize the current output.
Oh! Thanks for your time, that has cleared up a few of my misunderstandings.
Regarding the feature map section, I have 16 outputs and the:
axarr = plt.subplots(act.size(0))
Line won’t let me change the number of rows/columns to plot them in a way that is appropriate. It currently looks like this:
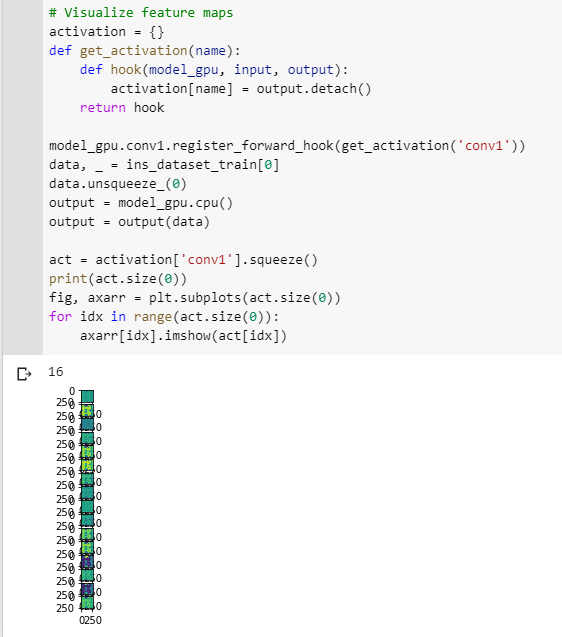
I tried to make a variable to replace act.size(0) but it seems that this line won’t accept anything else, I am not sure why.
put.subplots accepts the the number of rows as the first and number of columns as the second argument.
Which values have you passed to it that were not working?
I changed it to (4,4) and received this error:
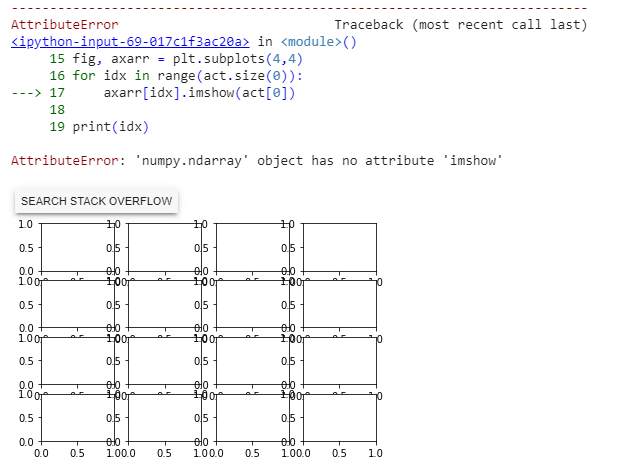
it seems to be with line 17 not the line I mentioned before apologies.
axarr will be a numpy array with the shape [4, 4], so you would need to index it as axarr[0, 0] or flatten it before using a linear index.
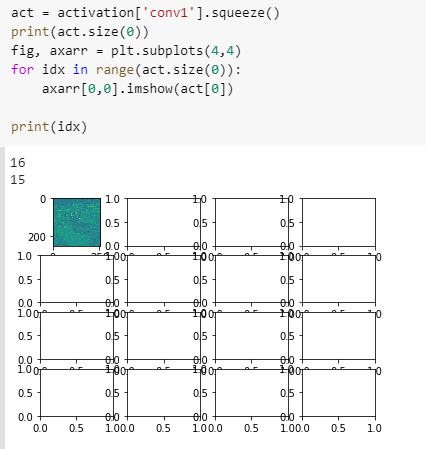
Thanks for your replies. After I index axarr as [0,0] I receive the error missing a required argument: 'X'
Update: I “fixed” the issue. However now only one image is plotted out of the 16 outputs:
Hello Ptrblck,
Sorry I want to see my feature maps I ues the above command but the error was yor model has not extractor. Indeed my model is 
class ConvNetRedo1(nn.Module):
    def __init__(self,numf1,numf2,fz1,fz2,nn2,nn3):
        super(ConvNetRedo1, self).__init__()
        self.numf1=numf1
        self.numf2=numf2
        self.fz1=fz1
        self.fz2=fz2
        self.nn2=nn2
        self.nn3=nn3
        self.layer1 = nn.Sequential(nn.Conv3d(1, self.numf1, kernel_size=self.fz1, stride=1, padding=1),nn.ReLU())
        self.layer2 = nn.Sequential(nn.Conv3d(self.numf1,self.numf2,kernel_size=self.fz2,stride=1,padding=0),nn.ReLU(),nn.MaxPool3d(kernel_size=2, stride=2))


        self.fc1 = nn.Linear(2048, self.nn2)
        self.drop_out1 = nn.Dropout(0.3)
        self.relu1 = nn.ReLU()

        self.fc2 = nn.Linear( self.nn2, self.nn3)
        self.drop_out2 = nn.Dropout(0.3)
        self.relu2 = nn.ReLU()
        self.fc3 = nn.Linear( self.nn3, 1)


    def forward(self, x):

        x=x.unsqueeze(1).float()
        out = self.layer1(x)
        out = self.layer2(out)
        out = out.view(out.size(0), -1)
        out = self.fc1(out)
        out=self.drop_out1(out)
        out=self.relu1(out)

        out = self.fc2(out)
        out=self.drop_out2(out)
        out=self.relu2(out)


        out = self.fc3(out)
Would you please tell me how I can see the feature maps or kernels?
Which feature map would you like to visualize?
My code snippet should also work for you, if you use the corresponding layer to add the forward hook. 
sorry, the way that I define the CNN layers is different, there is no self.Conv2 and like that , should I change the way of defining the layers to have sth like you?