Is there a easy way to check that the gradient flow is proper in the network? Or is it broke somewhere in the network?
Will this gradcheck be useful? How do I use it? Example?
Is there a easy way to check that the gradient flow is proper in the network? Or is it broke somewhere in the network?
Will this gradcheck be useful? How do I use it? Example?
Gradcheck checks a single function (or a composition) for correctness, eg when you are implementing new functions and derivatives.
For your application, which sounds more like “I have a network, where does funny business occur”, Adam Paszke’s script to find bad gradients in the computational graph might be a better starting point. Check out the thread below.
Best regards
Thomas
Thanks @tom
But when I use it in my network:
...
import bad_grad_viz as bad_grad
...
loss_G , loss_D = model(data_1, data_2)
get_dot = bad_grad.register_hooks(loss_1)
model.optimizer_network.zero_grad()
loss_G.backward()
loss_D.backward()
dot = get_dot()
dot.save('/path/to/dir/tmp.dot')
I get this error from bad_grad_viz.py:
grad_output = grad_output.data
AttributeError: 'NoneType' object had no attribute 'data'
More info:
model is a GAN network.
print(type(loss_G))
>>> <class 'torch.autograd.variable.Variable'>
print(type(loss_D))
>>> <class 'torch.autograd.variable.Variable'>
print(loss_G.requires_grad)
>>> True
print(loss_D.requires_grad)
>>> True
Any suggestion @apaszke ?
What if you test that condition and return False?
Try 1:
def is_bad_grad(grad_output):
        if grad_output.requires_grad == True:
            print('grad_ouput have grad')
        grad_output = grad_output.data
Error:
if grad_output.requires_grad == True:
AttributeError: 'NoneType' object has no attribute 'requires_grad'
Try 2:
def is_bad_grad(grad_output):
        if grad_output.requires_grad == False:
            print('grad_ouput doesnt have grad')
        grad_output = grad_output.data
Error:
grad_ouput doesnt have grad
grad_ouput doesnt have grad
grad_ouput doesnt have grad
grad_ouput doesnt have grad
grad_ouput doesnt have grad
grad_ouput doesnt have grad
grad_ouput doesnt have grad
grad_ouput doesnt have grad
grad_ouput doesnt have grad
grad_ouput doesnt have grad
grad_ouput doesnt have grad
grad_ouput doesnt have grad
grad_ouput doesnt have grad
grad_ouput doesnt have grad
grad_ouput doesnt have grad
Traceback (most recent call last):
grad_ouput doesnt have grad
grad_ouput doesnt have grad
if grad_output.requires_grad == False:
AttributeError: 'NoneType' object has no attribute 'requires_grad'
Please give more details, so that i can debug this issue.
It seems that something you makes your output not require grads as much as one would expect, this could happen due to networks being in .eval() instead of .training(), or setting requires_grad = False manually or volatile or something entirely different…
If you had a minimal demo of how it happens, it would be easier to find out why it is not working.
Best regards
Thomas
I use a simple trick. I record the average gradients per layer in every training iteration and then plotting them at the end. If the average gradients are zero in the initial layers of the network then probably your network is too deep for the gradient to flow.
So this is how I do it -
def plot_grad_flow(named_parameters):
    ave_grads = []
    layers = []
    for n, p in named_parameters:
        if(p.requires_grad) and ("bias" not in n):
            layers.append(n)
            ave_grads.append(p.grad.abs().mean())
    plt.plot(ave_grads, alpha=0.3, color="b")
    plt.hlines(0, 0, len(ave_grads)+1, linewidth=1, color="k" )
    plt.xticks(range(0,len(ave_grads), 1), layers, rotation="vertical")
    plt.xlim(xmin=0, xmax=len(ave_grads))
    plt.xlabel("Layers")
    plt.ylabel("average gradient")
    plt.title("Gradient flow")
    plt.grid(True)
loss = self.criterion(outputs, labels)
loss.backward()
plot_grad_flow(model.named_parameters())


This is my training iteration. I need to check the gradient. I incorporated what you suggested.
I am getting this error.
grad_output = grad_output.data**
atributeError: ‘NoneType’ object has no attribute ‘data’**
The code snippet:
for i,batch in enumerate(train_loader):
if (i%100)==0:
print(epoch,i,len(train_loader))
          #Clear the GRADIENT
          optimizer.zero_grad()
          #INPUT
          imgs,ques,ans = batch
          #imgs,ques,ans = imgs.cuda(),ques.cuda(),ans.cuda()
          imgs,ques,ans = imgs.to(device),ques.to(device),ans.to(device)
          #FORWARD PASS
          #OUTPUT

          ansout,queryout = net(imgs,ques,ans)

          #LOSS CALCULATED
          #Here answer is my target thus ".data" is used
          queryloss = loss(queryout, ansout.data)
          #Here query is my target
          ansloss = loss(ansout, queryout.data)
          get_dot = check_grad.register_hooks(ansloss)
          #MSE Added
          #print(ansloss)
          sum_ans_train += ansloss.item()
          queryloss.backward(retain_graph=True)

          #BACKPROPAGATION
          ansloss.backward()
          dot = get_dot()
dot.save('/home/Abhishek/plots/tmp.dot')A much better implementation of the function 
def plot_grad_flow(named_parameters):
    '''Plots the gradients flowing through different layers in the net during training.
    Can be used for checking for possible gradient vanishing / exploding problems.

    Usage: Plug this function in Trainer class after loss.backwards() as
    "plot_grad_flow(self.model.named_parameters())" to visualize the gradient flow'''
    ave_grads = []
    max_grads= []
    layers = []
    for n, p in named_parameters:
        if(p.requires_grad) and ("bias" not in n):
            layers.append(n)
            ave_grads.append(p.grad.abs().mean())
            max_grads.append(p.grad.abs().max())
    plt.bar(np.arange(len(max_grads)), max_grads, alpha=0.1, lw=1, color="c")
    plt.bar(np.arange(len(max_grads)), ave_grads, alpha=0.1, lw=1, color="b")
    plt.hlines(0, 0, len(ave_grads)+1, lw=2, color="k" )
    plt.xticks(range(0,len(ave_grads), 1), layers, rotation="vertical")
    plt.xlim(left=0, right=len(ave_grads))
    plt.ylim(bottom = -0.001, top=0.02) # zoom in on the lower gradient regions
    plt.xlabel("Layers")
    plt.ylabel("average gradient")
    plt.title("Gradient flow")
    plt.grid(True)
    plt.legend([Line2D([0], [0], color="c", lw=4),
                Line2D([0], [0], color="b", lw=4),
                Line2D([0], [0], color="k", lw=4)], ['max-gradient', 'mean-gradient', 'zero-gradient'])
simply wanted to comment that this^ is a wonderfully written function to inspect gradients -> highly recommend.
I have a peculiar problem. Thanks to the function provided above I was able to see the gradient flow but to my dismay, the graphs show the gradient decreasing from right side to left side, which is as God intended. But, in my case the graphs show the gradient decreasing from left side to right side, which is clearly wrong, albeit, I will be highly grateful if somebody can tell me what’s going on with the network.
It has a convolutional block followed by an encoder and decoder. The network is fully convolutional.
I will be highly grateful for any help provided.
I have a class of VGG16 and I wonder if named_parameters in your function refers to model.parameters()? model is an instance of class VGG16 by the way. If your response is ‘yes’ then I receive an error ‘too many values to unpack (expected 2)’ for command ‘for n, p in model.parameters():’. Do you see the reason?
For any nn.Module instance, m.named_parameters() returns an iterator over pairs of name, parameter, while m.parameters() just returns one for the parameters.
You should be able to use m.named_parameters().
Best regards
Thomas
This helped a lot. Thank you very much.
Best Regards
There is a place in heaven for people like you! Any chance pytorch is integrating something alike soon?
@RoshanRane
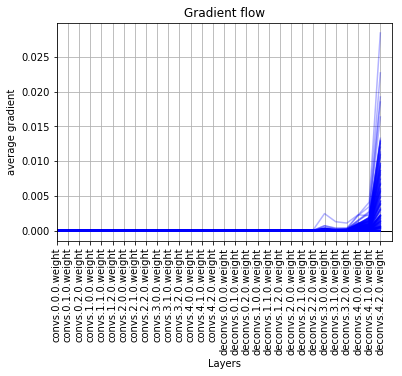
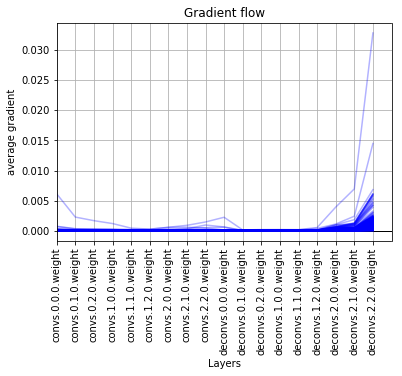
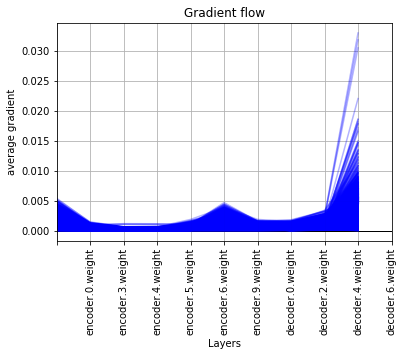
I used your code for plotting the gradient flow (thank you!), and obtained this output:
With the second implementation I obtain the following output:
This is for a single layer GRU. I was surprised to see the gradient of the hidden state stay so small. The only thing I can think of as to why this would be the case is because the hidden state is re-initialized with each training example (and thus stays small), while the other gradients accumulate as a result of being connected to learned parameters. Does that seem correct? Is this what a plot of the gradient flow in a single layer GRU should typically look like?
Alternatively, for a 4 layer LSTM, I get the following output:
Does that seem correct? Is this what a plot of the gradient flow in a multi-layer layer LSTM should typically look like? The larger gradient values are from the initial epochs. I am not sure when they are so much larger to start with. Thoughts?
not sure what is Line2Din your code???
Its a function from the matplotlib library, just add this line to the top of your script:
from matplotlib.lines import Line2D
You can import it as from matplotlib.lines import Line2D
Just a comment. I’m trying to measure the behaviour of Generative nets, specifically a UNet, so I looked at this, Implemented something in tensorboard and realized that while yes, one does get gradient flow graphs similar to what you show, it isnt quite as straightforwards. The larger the number of weight parameters, the lower the gradient has to be so it does not explode. So you may want to look at the gradients in logscale. Here are 2 representations. The first is similar to the code above, where x:layer number (0 thru 28), y:abs mean gradient (or signed max), z: iteration; uses SummaryWriter.add_histogram_raw() the second x:iteration, y:absmean gradient; using .add_scalars() 